Statistical Significance and Population Controls
340 likes | 520 Vues
Statistical Significance and Population Controls. Presented to the New Jersey SDC Annual Network Meeting June 6, 2007 Tony Tersine, U.S. Census Bureau. Overview of the Session. Basic Concepts Margin of Error Confidence Intervals Standard Error Formulas Statistical Testing

Statistical Significance and Population Controls
E N D
Presentation Transcript
Statistical Significance and Population Controls Presented to the New Jersey SDC Annual Network Meeting June 6, 2007 Tony Tersine, U.S. Census Bureau
Overview of the Session • Basic Concepts • Margin of Error • Confidence Intervals • Standard Error Formulas • Statistical Testing • Population Controls
Basic Concepts - 1 • Sampling error is introduced due to sampling, selection of a subset of the population to draw inferences about the entire population. • Standard error is an estimate of the precision of the estimates. It measures the variability of an estimate due to sampling.
Basic Concepts - 2 • The sampling error is often reported as the estimate “plus or minus” the margin of error, a measure of how precise the estimate is. • The margin of error describes the precision of the estimate at a given confidence level.
Basic Concepts - 3 • The confidence level measures the likelihood that the true value is within the margin of error of the sample estimate. • The Census Bureau statistical standard for published data is to use the 90 percent confidence level.
Margin of Error • The margin of error is important because relying on statistical inference can save you from drawing incorrect conclusions from data based on a sample. • It can help prevent you from interpreting small or nonexistent differences as important.
Margin of Error (MOE) • MOE = 1.65 * Standard Error • 1.65 is used for the 90 percent confidence level • Standard Error = MOE / 1.65 • Starting in 2006 ACS will use 1.645
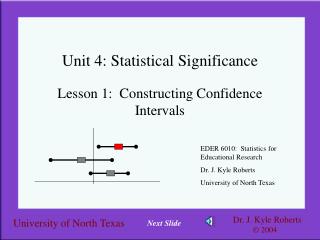
Confidence Interval • Confidence IntervalEstimate ± Margin of Error • 90 percent confidence levelMargin of Error = 1.645 * Std Error • 95 percent confidence levelMargin of Error = 1.96 * Std Error
Confidence Interval • The confidence interval tells you the upper and lower bounds of a range of values that may contain the true value. • It provides important information about the true value or the population parameter. • It tells you the limitations on using the estimates.
MOE / Confidence Interval • Median Family Income – $30,000 • Standard Error – $1,500 • 90% MOE = 1.645 * $1,500 = $2,468 • 90% CI = $30,000 ± $2,468 = • $27,532 to $32,468
Standard Error – Sum/Difference • Standard Error of X + Y or X – Y • SE(X+Y) = SE(X-Y)
Standard Error – Sum • SE(X1+X2+…+Xn)
Standard Error – Proportions • P= X / Y – X is a subset of Y • SE(P)
Standard Error – Ratios • X / Y – X is not a subset of Y • SE(X / Y)
Statistical Testing • Two estimates are "significantly different" at the 90 percent confidence level if the difference between them is large enough to infer that there was a less than 10 percent chance that the difference was purely random. • Users may want to compare estimates across years or geographies. • It is important to note that small differences, which may be statistically significant, may not have any practical significance.
Statistical Testing - Steps • State that two estimates are statistically different if the difference between the two estimates is statistically different from zero. • Calculate the standard error of the difference.
Statistical Testing - Steps • Calculate the margin of error of the difference. • Compare the original difference between the estimates to the margin of error of the difference.
Statistical Testing - Steps • If the difference is greater than the margin of error, then you conclude that the two estimates are significantly different. • If the difference is less than the margin of error, you conclude that the two estimates are not significantly different.
Statistical Testing - Example • Percent with Bachelor’s Degree or Higher • Geography Percent MOE CI • Area 1 20.0 ± 5.0 15.0-25.0 • Area 2 12.3 ± 4.7 7.6-17.0 • Difference = 20.0 – 12.3 = 7.7
Statistical Testing - Example • MOE of the Difference - Standard Errors for Each Estimate • SE = MOE / 1.65 • SE(Area 1) = 5.0 / 1.65 = 3.03 • SE(Area 2) = 4.7 / 1.65 = 2.85
Statistical Testing - Example • Standard Error of the Difference • Margin of Error of the Difference • MOE(X - Y) = 1.65 * 4.16 = 6.9
Statistical Testing - Example • Compare the Difference to MOE • Difference = 7.7% • MOE = 6.9% • Difference > MOE • Conclude that the two estimates are significantly different with 90 percent confidence
Census 2000 – Example • Percent Bachelor’s Degree or Higher – Alexandria, VA • 51,982 / 95,730 = 54.3% • DF = 1.2 – (13.4% in sample) • 90% MOE =1.65 * 0.4 = 0.7 • 90% CI = 54.3 ± 0.7 = 53.6 to 55.0
Rules to Remember • Don’t make a big deal of small differences. • If the confidence intervals overlap you cannot conclude the difference is not statistically significant. • Always talk to subject matter experts before making any conclusions.
Population Controls - Rational • Correct for coverage • Higher undercoverage in surveys than in census • Reduce variance estimates
Population Controls • Intercensal estimates are produced by updating the previous census results using various administrative records data and ACS data on foreign-born • In a multi-stage process, HU, GQ, and population adjustment ratios are applied to the weights
GQ Controls • GQ population controls applied at the STATE level by 7 major types. • Collapsing across types if not enough sample • Always control to at least Institutional / Non-Institutional Population
Housing Unit Controls • Applied at a weighting area level • New step to make all 3 agree • Households • Householders • Occupied Housing Units • Housing Units will not be controlled
Weighting Areas • Controls applied at the weighting area (county or group of counties) level • 1343 weighting areas consist of a single county • All 21 New Jersey counties are weighting areas • The other 607 weighting areas are made up of 1798 counties
HU Population Controls • Controls applied by race/ethnicity and age/sex groups • ACS GQ estimates subtracted from population estimates to obtain controls • Collapsing of race/ethnicity and age/sex groups
Why Do Place Estimates Differ • ACS does not control subcounty areas • 1-person households • Lower response rate • Multi-Unit Structures • Conversion of single to multi-unit
U.S. DEPARTMENT OF COMMERCE U.S. Census Bureau Washington, DC 20233 Anthony Tersine Room: 4H477 Phone: 301-763-1994 Email: Anthony.G.Tersine.Jr@census.gov Contact Information