Download

1 / 19
200 likes | 394 Vues
If you are viewing this slideshow within a browser window, select File/Save as… from the toolbar and save the slideshow to your computer, then open it directly in PowerPoint. When you open the file, use the full-screen view to see the information on each slide build sequentially.

E N D
If you are viewing this slideshow within a browser window, select File/Save as… from the toolbar and save the slideshow to your computer, then open it directly in PowerPoint. • When you open the file, use the full-screen view to see the information on each slide build sequentially. • For full-screen view, click on this icon at the lower left of your screen. • To go forwards, left-click or hit the space bar, PdDn or key. • To go backwards, hit the PgUp or key. • To exit from full-screen view, hit the Esc (escape) key.
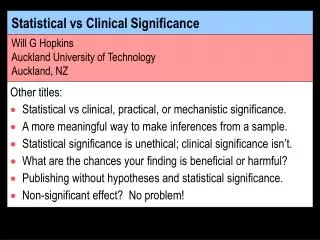
probability beneficial trivial harmful value of effect statistic Clinical, Practical or Mechanistic Significancevs Statistical Significance for POPULATION Effects Will G HopkinsAuckland University of TechnologyAuckland, NZ
Overview • Background: Making Inferences • Hypothesis Testing, P Values, Statistical significance • Clinical Significance via Confidence Limits • Clinical Significance via Clinical Chances • Precision of estimation • Smallest worthwhile effect • Interpreting Probabilities • How to Publish Clinical Chances • Probabilities of benefit and harm • How to use possible, likely, very likely, almost certain • Examples
Background: Making Inferences • The main aim of research is to make an inference about an effect in a population based on study of a sample. • Alan will deal with inferences about the effect on an individual. • Hypothesis testing via the P value and statistical significance is thetraditionalbut flawed approach to making an inference. • Precision of estimation via confidence limits is an improvement. • But what's missing is some way to make inferences about the clinical, practical or mechanistic significance of an effect. • I will explain how to do it via confidence limits using values for the smallest beneficial and harmful effect. • I will also explain how to do it by calculating and interpreting chances that an effect is beneficial, trivial, and harmful.
Hypothesis Testing, P Values and Statistical Significance • Based on the notion that we can disprove, but not prove, things. • Therefore, we need a thing to disprove. • Let's try the null hypothesis: the population or true effect is zero. • If the value of the observed effect is unlikely under this assumption, we reject (disprove) the null hypothesis. • Unlikely is related to (but not equal to) the P value. • P < 0.05 is regarded as unlikely enough to reject the null hypothesis (that is, to conclude the effect is not zero or null). • We say the effect is statistically significant at the 0.05 or 5% level. • Some folks also say there is a real effect. • P > 0.05 means there is not enough evidence to reject the null. • We say the effect is statistically non-significant. • Some folks also accept the null and say there is no effect.
Problems with this philosophy… • We can disprove things only in pure mathematics, not in real life. • Failure to reject the null doesn't mean we have to accept the null. • In any case, true effects are always "real", never zero. So… • THE NULL HYPOTHESIS IS ALWAYS FALSE! • Therefore, to assume that effects are zero until disproved is illogical and sometimes impractical or unethical. • 0.05 is arbitrary. • The P value is not a probability of anything in reality. • Some useful effects aren't statistically significant. • Some statistically significant effects aren't useful. • Non-significant is usually misinterpreted as unpublishable. • So good data are lost to meta-analysis and publication bias is rife. • Two solutions: clinicalsignificance via confidence limits or via clinical chances.
probability distributionof true value, giventhe observed value Area = 0.95 probability observed value lower likely limit upper likely limit 0 negative positive value of effect statistic likely rangeof true value 0 negative positive value of effect statistic Clinical Significance via Confidence Limits • Confidence limits define a range within which we infer the true or population value is likely to fall. • Likely is usually a probability of 0.95(for 95% limits). • Representation of the limitsas a confidence interval:
Problem: 95% is arbitrary. • And we need something other than 95% to stop folks seeing if the effect is significant at the 5% level. • The effect is significant if the 95% confidence interval does not overlap the null. • 99% would give an impression of too much imprecision. • although even higher confidence could be justified sometimes. • 90% is a good default, because… • Chances that true value is < lower limit are very unlikely (5%),and… • Chances that true value is > upper limit are very unlikely (5%).
harmful trivial beneficial smallestclinicallyharmfuleffect smallestclinicallybeneficialeffect 0 negative positive value of effect statistic • Now, for clinicalsignificance, we need to interpret confidence limits in relation to the smallest clinically beneficial and harmful effects. • These are usually equal and opposite in sign. • They define regions of beneficial, trivial, and harmful values.
Clinicallydecisive? Statisticallysignificant? harmful trivial beneficial Yes: don't use it. No Yes: don't use it. No Yes: don't use it. Yes Yes: don't use it. Yes No: need moreresearch. No 0 negative positive Why statistical significance is impractical or unethical! value of effect statistic • Putting the confidence interval and these regions together, we can make a decision about clinical significance. • Clinicallydecisive or clear is preferable to clinically significant. Yes: use it. Yes Bars are 95%confidenceintervals. Yes: use it. Yes Yes: use it. No Yes: don't use it. Yes
Problem: what's the smallest clinically important effect? • If you can't answer this question, quit the field. • Example: in many solo sports, ~0.5% change in power output changes substantially a top athlete's chances of winning. • The default for most other populations and effects is Cohen's set of smallest values. • These values apply to clinical, practical and/or mechanistic importance… • Correlations: 0.10. • Relative frequencies, relative risks, or odds ratios: 1.1, depending on prevalence of the disease or other condition. • Standardized changes or differences in the mean: 0.20 between-subject standard deviations. • In a controlled trial, it's the SD of all subjects in the pre-test, not the SD of the change scores.
probabilitydistributionof true value probability smallestbeneficialvalue Pbeneficial= 0.80 smallestharmfulvalue Pharmful= 0.05 Ptrivial= 0.15 observed value 0 negative positive value of effect statistic Clinical Significance via Clinical Chances • We calculate probabilities that the true effect could be clinically beneficial, trivial, or harmful (Pbeneficial, Ptrivial, Pharmful). • These Ps are NOT the proportions of positive,non- and negativeresponders in the population. • Alan will deal with these. • Calculating the Ps is easy. • Put the observed value, smallest beneficial/harmful value, and P value into a spreadsheet at newstats.org. • More challenging: interpreting the probabilities, and publishing the work.
Probability Chances Odds The effect… beneficial/trivial/harmful <0.01 <1% <1:99 is almost certainly not… 0.01–0.05 1–5% 1:99–1:19 is very unlikely to be… 0.05–0.25 5–25% 1:19–1:3 is unlikely to be…, is probably not… 0.25–0.75 25–75% 1:3–3:1 is possibly (not)…, may (not) be… 0.75–0.95 75–95% 3:1–19:1 is likely to be…, is probably… 0.95–0.99 95–99% 19:1–99:1 is very likely to be… >0.99 >99% >99:1 is almost certainly… Interpreting the Probabilities • You should describe outcomes in plain language in your paper. • Therefore you need to describe the probabilities that the effect is beneficial, trivial, and/or harmful. • Suggested scheme:
Mean improvement Chances (% and qualitative) (%) and 90% Compared groups of substantial improvementa confidence limits Slow - control 3.1; ±1.6 99.6; almost certain Explosive - control 2.0; ±1.2 98; very likely a Increase in speed of >0.5%. Slow - explosive 1.1; ±1.4 74; possible How to Publish Clinical Chances • Example of a table from a randomized controlled trial: TABLE 1–Differences in improvements in kayaking sprint speed between slow, explosive and control training groups. Chances of a substantial impairment were all <5% (very unlikely).
Example in body of the text: • Chances (%) that the true effect was beneficial/trivial/harmful were 74/23/3 (possible/unlikely/very unlikely). • In discussing an effect, use clear-cut or clinically significant or decisive when… • Chances of benefit or harm are either at least very likely (>95%) or at most very unlikely (<5%), because… • The true value of some effects is near the smallest clinically beneficial value, so for these effects… • You would need a huge sample size to distinguish confidently between trivial and beneficial. And anyway… • What matters clinically is that the effect is very unlikely to be harmful, for which you need only a modest sample size. • And vice versa for effects near the threshold for harm. • Otherwise, state more research is needed to clarify the effect.
threshold values value of Conf. deg. of Confidence limits for clinical chances P value statistic level (%) freedom lower upper positive negative 0.03 1.5 90 18 0.4 2.6 1 -1 0.20 2.4 90 18 -0.7 5.5 1 -1 Chances (% or odds) that the true value of the statistic is clinically positive clinically trivial clinically negative prob (%) odds prob (%) odds prob (%) odds 78 3:1 22 1:3 0 1:2071 likely, probable unlikely, probably not almost certainly not 78 3:1 19 1:4 3 1:30 likely, probable unlikely, probably not very unlikely • Two examples of use of the spreadsheet for clinical chances: Both theseeffects areclinically decisive, clear, or significant.
Limitations of this approach to clinical decisions • It deals with uncertainty about the magnitude of an effect in a population. • Which is OK for effects like correlations or simple mean differences between groups, which don't apply to individuals. • But effects like risk of injury or changes in physiology or performance can apply to individuals. • Alas, this approach does NOT provide the uncertainty of the effect or chances of benefit and harm for an individual. • Neither does statistical significance. • More information and analyses are needed to make clinical decisions for individuals.
Summary • Show the observed magnitude of the effect. • Attend to precision of estimation by showing 90% confidence limits of the true value. • Do NOT show p values, do NOT test a hypothesis and do NOT mention statistical significance. • Attend to clinical, practical or mechanistic significance by… • stating, with justification, the smallest worthwhile effect, then… • interpreting the confidence limits in relation to this effect, or… • estimatingprobabilities that the true effect is beneficial, trivial, and/or harmful (or substantially positive, trivial, and/or negative). • Make a qualitative statement about the clinical or practical significance of the effect, using unlikely, very likely, and so on. • Remember, it applies to populations, not individuals.
For related articles and resources: A New View of Statistics newstats.org SUMMARIZING DATA GENERALIZING TO A POPULATION Simple & Effect Statistics Precision of Measurement Confidence Limits Statistical Models Dimension Reduction Sample-Size Estimation