A unified statistical framework for sequence comparison and structure comparison
A unified statistical framework for sequence comparison and structure comparison. Michael Levitt Mark Gerstein. Statistics Introduction. Statistics is the discipline which deals with inference in the presence of variation Given a score, how significant is it?

A unified statistical framework for sequence comparison and structure comparison
E N D
Presentation Transcript
A unified statistical frameworkfor sequence comparison and structure comparison Michael Levitt Mark Gerstein
Statistics Introduction • Statistics is the discipline which deals with inference in the presence of variation • Given a score, how significant is it? • Ho , HA , Critical Region, P-value Extreme Value Distribution-maximum over all sequence scores is distributed as Extreme Value Distribution Reason why extreme value distribution is useful: maximize score over all possible random alignments
Introduction • Given sequence and structural scores, develop hypothesis testing framework • Ho : Two proteins compared are unrelated • Distribution of scores of unrelated proteins determined empirically using PDB data at 40% sequence identity No assumption of background distribution
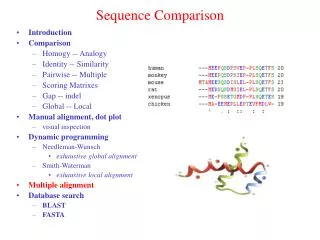
Sequence Comparison Framework • Sequence score determined by SSEARCH and BLOSUM 50 substitution matrix • Sseq (sequence score), n and m (lengths of two sequences compared) in p.d.f. • Compared all possible pairs to determine empirically the p.d.f.
Density Distribution for constant ln(nm) • Density distribution follows extreme value distribution: exp(-Z –exp(-Z))= pcseq(Z) • Z=(Sseq - µseq)/ơseq • µseq = a ln(nm) + b; model average; a and b fitted to the observed density by least squares • ơseq = a
Comparison to BLAST and FASTA statistics • Critical region to determine p-value for model: Pseq(z>Z) • Comparison of model p-values with BLAST p-value found BLAST p-value higher than model • FASTA statistic better coverage, more error than model
Structure Comparison Framework • The score obtained from the structure comparison algorithm is Sstr • P.d.f. for Sstr used N (number of residues matched) and Sstr (pairs which scored high were removed) • Kept N fixed and fitted extreme value distribution to density using all N
Comparison with RMS • RMS deviation in alpha-carbon after least squares fit is traditional method • RMS score used to determine p.d.f. with ln(RMS score) and N • Comparison of RMS with Sstr found RMS worse than S in coverage and accuracy
Comparison with RMS (cont.) • Three reasons: • Sstr depends most strongly on best-fitting atoms; RMS depends most on worst-fitting atoms • Sstr penalizes gaps; RMS does not • Sstr is analogous to Sseq in the sense that both use dynamic-programming
Concluding Remarks • Significance of sequence structure score can be calculated from any structural alignment program • This method of statistical significance is between FASTA and BLAST methods
Efficient Detection of Three-Dimensional Structural Motifs in Biological Macromolecules By Computer Vision Techniques Ruth Nussinov Haim J. Wolfson
Introduction • One of the earlier papers addressing structure comparison • Based on computer vision techniques ( geometric hashing paradigm) • No a priori predefined motif assumed • Advantage: Can be parallelized
Problem • Given 3D coordinates of atoms of two molecules, find a rigid transformation (rotation and translation allowed) so that a large number of atoms of one molecule match the atoms of the other molecule • Closely related to 3D rigid object recognition
Geometric Hashing Paradigm:Representation of Geometric Constraints • Proteins represented as points using coordinate frames (minimal representation of coordinate frames) • Pick three noncolinear points to define a plane (RS) and construct orthogonal 3D coordinate system based on RS
Representation of Geometric Constraints (cont.) • Define orthonormal vectors w.r.t. RS so that any point can be represented as a linear combination of the orthonormal vectors • To remove dependence on particular RS (may preclude recognition if at least one of the RS points does not match with input substructure), represent the m points in all basis triplets (I.e. all orthonormal vectors) with all possible RS
Algorithm for Representation of Geometric Constraints For each RS { • Compute orthonormal 3D basis associated with each RS • Compute coordinates of all other points in coordinate frame defined by 3D basis • For each point define address of hash table with labels and measurements • Use each address to enter hash table with pair (model, RS) }
Determining Hash Table Entries with Model M1 and Points 4 and 1 as Basis
Locations of Hash Table Entries for Model M1 after all bases, RS
Geometric Hashing: Matching • Given observed object: • 1. Choose an RS and compute 3D basis associated with RS • 2. Compute the coordinates of the other observed object points in 3D basis • 3. For each point, enter hash table at address defined by labels and measurements and label and coordinate of new point
Geometric Hashing: Matching (cont.) • For step 3: Tally a vote for model and RS for each entry found at address; can histogram all hash table entries which received one or more votes 4. If no pair scores high (determine by threshold), then go to 1, and begin with different RS of the observed object
Geometric Hashing: Matching (cont.) 5. Consider all the models from step 4 and find rigid motion that gives best least squares match 6. Transform the model point set according to the transformation of step 5 and check consistency of all biological information (I.e. match labeling)
Modifications to Algorithm • Could modify voting scheme, modify representation of coordinate axes to 2D coordinate axes (reduces worst case running time analysis), could apply representation of atoms to alpha-carbons only (no labeling allowed), could group atoms together into a single unit and analyze structures using these atom groups
Algorithm Performance • Experimented with bacterial proteins, bovine pancreas protein, calcium binding protein, bovine liver protein, and protein from hen egg All experiments were “favorable” to “excellent” results in terms of fit
Conclusion • Algorithm needs O(N x m4) for hash table (can be big for large N, m) • Running time for algorithm can also be long • Can be parallelized (ie. representation stage independent of matching stage) • Sequence order independent (ie. Insensitive to gaps, insertions, deletions)