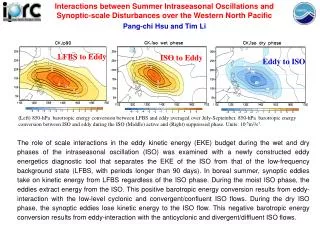
Download
1 / 32
320 likes | 352 Vues
Explore the application of quantitative models in Marine Protected Area (MPA) design. Discuss eddy diffusivity on shallow continental shelves and its effects on dispersion. Learn about larval dispersal measurement methods, strategic and tactical models, and the importance of spatial location in MPA design. Discover source-sink dynamics, settlement distributions, and connectivity matrices in MPA planning. Gain insights into dispersion in coastal waters and the role of eddy diffusivity. Stay informed about quantitative models for reef fish populations and deepwater species. Access valuable information to enhance your understanding of marine environments.

E N D
Application of quantitative dispersal models to the design of MPAs;eddy diffusivity and exchange on shallow continental shelves Karen Pehrson Edwards Oral Exam Sept. 26, 2005
History of MPAs in the SAFMC 1990 2004
Fisheries Effects of MPAs Russ, 2001.
Outline • Measuring Larval Dispersal • Strategic models & MPAs • Tactical models • Georges Bank Scallops • Great Barrier Reef • Application of quantitative models to the SAB • Eddy diffusivity and dispersion • Conclusions
Methods to Study Dispersal • Movement-redistribution methods or direct tracking of individuals • Depends on relative body size and dispersal distance(Nathan 2001) • Genetic Analysis • Relate mean dispersal distance to the increase in genetic differentiation with distance, or isolation-by-distance (IBD)(Kinlan and Gaines, 2003). • Models • Simplest models estimate larval dispersal from the duration of the pelagic larval stage combined with the movement of passive particles in low-frequency currents(Grantham et al., 2003; Shanks et al., 2003, and references therein)
Larval Pool 1 2 3 4 Stepping Stone 1 2 3 4 Strategic Models for MPAs Pure diffusion • Larval movement is typically represented by one of 3 simple abstractions: • Question answered: Predicted area needed in reserves • Schematic of marine reserve network Gell & Roberts 2003
Source-Sink Dynamics and MPAs Model design: hypothetical ‘archipelago’ of reefs includes 20 reefs in a 4x5 array. Looked at population response to reserve placement. Suggests that not only habitat quality (sources and sinks) but spatial location of reserves relative to physical factors is important in MPA design. Crowder et al. 2000
Tactical Models: Georges Bank Scallops 1998 Scallop abundance from dredge survey tows John Quinlan, ECOHAB/GLOBEC Portland ME, June 17-18, 2002 Murawski et al., 2000 http://www-nml.dartmouth.edu/Publications/internal_reports/NML-00-2/
Closed Area 1 Closed Area 2 Closed Area 2 Closed Area 1 Nantucket Lightship Hudson Canyon NLS Hudson Canyon Virginia Beach Scallop source/sink dynamics along the east coast Settlement Distributions John Quinlan, ECOHAB/GLOBEC Portland ME, June 17-18, 2002
Larval dispersal on the Great Barrier Reef Larval Retention 1985 1989 >0.2 0.1 - 0.2 < 0.1 >0.02 0.01 - 0.02 0.005 - 0.01 <0.005 1996 Avg Creation of Connectivity Matrix James et al., 2002
Quantitative dispersal models and MPA’s on the SAB Use dispersal kernels to create connectivity matrices of hard bottom reefs on the SAB shelf. All Spring Runs Provided by Harvey Walsh, NOAA Beaufort
Current SAFMC Proposed MPA’s • Deepwater snapper/ grouper complex: rely on estuarine habitats for juvenile stage - larvae must cross the shelf. • Lack information linking spawning sites to estuarine habitat and which spawning sites (proposed MPAs) have most successful larvae.
Quantitative dispersal models and MPA’s on the SAB Quantifying Arrival Kernels: Use arrival kernels to quantify larval transport from the shelf-edge proposed MPA/ spawning sites to inlets. The figure shows the starting locations of larvae arriving at each inlet. Hare et al, 1999 John Quinlan, ECOHAB/GLOBEC Portland ME, June 17-18, 2002
Quantitative dispersal models and MPA’s on the SAB • For reef fish populations on the shelf and for deepwater snapper/grouper proposed MPAs: • With realistic 3D flow fields available, • Spawning sites and times, and estimates of larval behavior, • Create quantitative dispersal/arrival kernels. • Aggregating the kernels to create Connectivity Matrices (aij(t)), • A network of MPAs could be designed or tested.
Eddy diffusivity and exchange on shallow continental shelves
Dispersion http://marine.rutgers.edu/cool/latte/images/CT_plume.jpg • Diffusive mixing by turbulence. • Effect of different eddy scales on transport and spreading of a patch of material: • Eddies which are larger than the patch transport it without affecting its shape • Intermediate-scale eddies cause distortions which lengthen the boundary with the surrounding liquid • Eddies which are smaller than the patch play a diffusive role, smoothing out distortions or irregularities in shape • Dispersion in estuaries and coastal waters. 1926 Richardson: “observed the relative motion of two floating pieces of parsnip…”, Dispersion in estuaries and coastal waters.
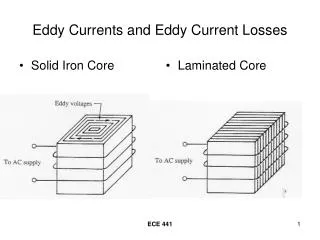
Shear Diffusion Spatial variations in velocity increase the surface area over which diffusive mixing can act. u z Kz Spreading due to vertical shear in horizontal advection. Include vertical diffusion or mixing, Kz.
Measuring Diffusion (Okubo’s rc (cm)) • In dye studies, eddy diffusivity, K (m2s-1), is a measure of the rate of increase of a patch of dye. • In modeling, K provides for diffusion due to sub-grid-scale processes or processes not included in the model. Calculate displacement added to particle velocity: Lewis, Dispersion in estuaries and coastal waters.
Oceanic Diffusion rc (km) Ka≈100 m2/sec month Sundermeyer (2001) 2rc= 0.0108t2.34 Ka 2rc/4t Ka= 0.0103l1.15 l 3rc Okubo, 1971.
Model K-test From Okubo (1971): l (typical length scale= 3rc) 100 km after 1 month K=1 m2/sec, l 50 km K=10 m2/sec, l 80 km K=100 m2/sec, l 180 km Using K=10 m2/sec in the model provides the appropriate length scale after one month. 2rc=2 s11 s22
Application to Larvae Dispersion studies of larvae and eggs in relation to Okubo’s Ka Dispersion vs. Age of Larvae Hare et al. (1999) McGurk, 1989
Conclusions • With simple climatology and M2 tides, reduce K from 100 m2s-1 (observed after 30 days) to 10 m2s-1 in model. • As larvae become capable of more behavior, passive diffusivity coefficients may no longer be valid. • Application of quantitative models to the SAB: • Connectivity matrices from an ensemble of dispersal kernels can be used to create network of MPAs. • Ideally, couple physics with metapopulation models.
I know that the human being and the fish can coexist. - George Bush
Questions/Open Issues? • Need to define level of connectivity that is ecologically feasible? What level of self-recruitment is needed in MPAs to maintain populations? • Need to define how close a larval fish gets to a reef before assuming that it finds it. • Important to know how much variability in the connectivity: interseasonal, interannual, longer term… • How big should MPAs be? GRNMS is 58km2. Individual reefs – too small and too difficult to enforce. Larger areas would have benefit of including between-reef habitat. • Need larval and adult fish surveys to validate models. Are larvae dispersing where models say? Are adults living and spawning on identified source reefs?
Putting Effort & Catch Together Murawski GLOBEC Talk
Ensemble Modelling • Ensemble forecasting: cover a larger part of the possible future through introduction of variation in initial conditions. • Perturb initial conditions (NCEP uses 11 member ensemble). • Multi-scheme ensemble uses variations in same model • Multi-model ensemble uses different models • Poor man’s ensemble: initial conditions from overlapping runs of Met Model Giebel et al., 2003
Artificial Tags Flourescent compounds (Jones et al., 1999) Elemental tags Radioactive isotopes Thermal marks Disadvantages Requires recapture of significant number of tagged individuals to draw valid conclusions; Natural Tags Genetic Markers Environmental Tags (Swearer et al., 1999) Disadvantages Natural tags are rarely unequivocal; Need signatures from all likely source regions Population Markers in Larval Dispersal Studies
A mark and recapture study of reef fish dispersal • Marked the otoliths (using tetracycline) of 10 million larval damselfish at six reef sites on the GBR • Later collected juveniles and found that 15 out of 5000 were originally from that reef • Estimated a retention of 15 to 60% Jones et al., 1999 Map of Lizard Island on the North Great Barrier Reef
Benefits of MPAs - Higher density of target species inside reserve. Adult Spillover: Adults have to spend most of their time in reserves Tagging and tracking large vertebrates: Bluefin Tuna movements Block et al
Ascidians (sea squirts) Colonial organism that is highly organized and closely related to vertebrates. They are filter feeders. Some form colonies, larger ones are solitary. home.att.net/ ~mmkdomanski/ascidians.jpg
ECOSPACE (ECOPATH/ECOSIM) • Results indicate larger/ fewer MPAs more effective than smaller/ many. • May be more appropriate for studying adult spillover. • Does not include physical transport or circulation even at a coarse scale. Salomon et al., 2002. 1,2,3,4 represent depth categories: 4=0-30m, 3=31-50m, 2=51-70m and 1=70+m Walters et al., 1999, Walters 2000 www.ecopath.org
Dispersal and connectivity Why are they important to measure? • Population and community ecology: understanding the basics • Management and conservation : Design and evaluate MPAs • Evolution: What causes genetic isolation and speciation? • Biogeography: Evaluate the extent to which range limits are set by barriers to dispersal rather than physical tolerances of adults • Introduced Species: What controls rates of spread of exotics • Dynamics of infectious diseases: Evaluate the role of linkages in the epidemiology of diseases.