Download
1 / 30
300 likes | 316 Vues
This summary provides an overview of the operations conducted during the first phase of SPARC, focusing on laser and cathode synchronization diagnostic and system commissioning. The results achieved, including successful RF waveguide and gun conditioning, are discussed along with the conclusions drawn from the operations.

E N D
Summary of SPARC first-phase operations Daniele Filippetto on behalf of SPARC team
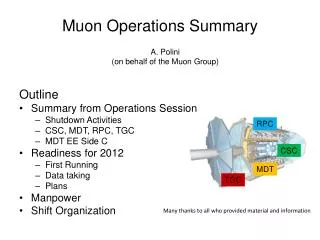
Outlines Layout (12/06) Laser and cathode Synhcronization Diagnostic and system commissioning Best results Conclusions
RF: Waveguide and gun conditioning successful Conditioning time~2 weeks Eacc~120MV/m Ekin=5.6MeV (e-)
Pulse shaper pumps oscillator amplifiers UV stretcher Harmonics generator Laser: High complexity system!! Daily optimization is required
Faraday cup Magnets E-meter ICT Beam dump Spectrometer cross Sparc hall:
Installation & characterization Transfer Line install. LC mask New stretcher Normal incidence Operation days: RF and timing systems; RF conditioning Beam operation Flat pulse Beam operation Gauss pulse Diagnostics development Flat top studies
Layout Laser and cathode operations Synhcronization systems Diagnostic overview and system commissioning Best results Conclusions
Longitudinal pulse shaping: two stages Minimum rise time of 3 ps with the dazzler only How to increase the Steepness: simulations
10 ps pulse 6 ps pulse 15 ps pulse Two stages pulse shaping:results • With the DAZZLER and the UV stretcher allow to easily change the pulse length and the time shape • During the run it was achieved rise time down to -1.4-1.5 ps Gaussian pulse
Transfer line and imaging: • Circular beam at cathode (>98%) • Front tilt compensation(< 200 fs) • Work for different spot sizes. • High energy losses: 65% • Sensitive to lens position (±1 mm) • Difficult to be measured • Poor transverse uniformity A grating parallel to the cathode was employed to diffract the beam at 72°. A lens was used to compensate the chromatism at the image plane. 72° incidence Better uniformity and lower losses A mirror in vacuum is required 90° incidence
New laser diagnostic: FESCA 200 UV pulse IR beam • Sub-ps resolution streak camera has been recently installed at LNF • The measured resolution is about 200 fs in the IR and 500 In the UV Flat top UV measurements A short IR pulse was used as reference in jitter corrected multiple image-acquisistion
Quantum efficiency optimization: Laser cleaning with 10 μJ and 100 μm spot size diameter. • Mean QE increased from 2.3 10^-5 to 10^-4 • Improved uniformity over a 4 mm square region 1nC electron bunch with 50 μJ laser energy (~6*10^13 photons @ 266nm)
Layout Laser and cathode operations Synhcronization systems Diagnostic overview and system commissioning Best results Conclusions
Synchronization: Time jitter maximum acceptable values: - SPARC phase I (achieved): ± 2ps between the Laser pulse and the Linac RF (RF gun mainly) - SPARC phase II (on the way): ± 0.5ps between the Laser pulse and the Linac RF (RF gun and RF compressor mainly) - Seeding@SPARC and next-generation experiments (under study): ± 0.1ps control of the bunch longitudinal position Synchronization strategy Laser to RF synchronization: • 1-5kHz bandwith piezo-electro-opticalfeedback (Synchrolock) • Standard laser IR oscillatortime jitter measurement • Innovative UV pulse single shot time arrival measurement RF to RF synchronization: • Feedback loops • Signal demodulation to monitorthe phase of the fields in the RF structures along the machine
RF to RF synchronization Slow feedback (BW<<1Hz): • Correction of the temperature drifts in the waveguides • Motorized phase shifters • 0.25ps RMS time jitter measured in the gun(with fast feedback off) Fast feedback (BW~1MHz): • Correction performed inside a single 4µs klystron pulse • Electronic phase shifters • 230fs open loop time jitter • 23fs closed loop time jitter
Agilent SSA (absolute) measurements SPARC monitor system (relative to RF) 350fs RMS 10Hz final amplified pulse measurement (best result is 400fs) New cavity filter used to reject the noise coming from high power RF structures 79.3MHz oscillator measurement(very good agreement with SSA)
Layout Laser and cathode operations Synhcronization systems Diagnostic overview and system commissioning Best results Conclusions
Image of streaked light from Aerogel (UCLA collaboration) T=12 ps Diagnostic overview • 60 cm: faraday cup to measure the charge at gun exit, and Cromox screen to see and center the beam; • 85-200 cm: E-meter (slits cross, Yag and CCD cross); Emittance, beam envelope, beam parameters as function of trnsv. coordinates; • 270 cm :aerogel + streak camera; beam length; • 300-330 cm :FODO; • 370 cm : dipole; • 400 cm : spectrometer cross (Yag+ CCD) ; E & ΔE meas. • 440 cm : ICT (beam charge) } prepare the beam to E & ΔE meas.
Envelope automatic measure The emittance-meter moves and stops in several (15-30) positions. Several images are collected at each point, and an algorithm calculates the RMS parameters and the error bars.
Emittance automatic measure an automated emittance scan has been developed, making use of the centroids and rms calculated from envelope scan. • 30 images each slit position • 13 slit positions each z position (sampling the beam with σ/2 step width) • 30 z positions • 11700 images & ~450 motor movements each ε evolution measurement The high measurement resolution allows to precisely reconstruct not only the second moment but the entire transverse trace space distribution (x-x’ or y-y’)
Data analysis It has been the first time of direct emittance evolution measurements and experimental study of dynamical behaviour Problems: • Need to know exactly the percent of charge used to calculate di emitt. (haloes estimation) • Same cut for emitt. meas. at different positions • High sensitivity needed to measure small fluctuations As result of collaboration between experimental & BD groups 3 independent alghoritms were developed for emittance calculations: • Alg. based on single image analysis and data extrapolation; • Alg. Based on trace space plot filtering; • Genetic alg. fitting 8 different ellispes with same centers, maximizing the (Intensity/Area) function; All the procedures have been compared with the simulations, and they showed a Very good agreement
Layout Laser and cathode operations Synhcronization systems Diagnostic overview and system commissioning Best results Conclusions
Emittance scan as function of B in a fixed point Isol=198 A The double minimum experimental evidence
Energy spread evolution along the drift • Demonstr. of negligible WF effect due to the bellows • Isolation of longitudinal space charge eff. • Study of longitudinal dynamics for different charges, RF phases and pulse lengths
Conclusions Commissioning of the system Flat top generation with UV pulses Nominal beam parameters Good agreement with simulations Phase space evolution Energy spread evolution Flat top Vs Gaussian Emittance oscillation