Download
1 / 19
190 likes | 216 Vues
This article compares the iPlant G-to-P Modeling Workflow with the DSSAT model, highlighting lessons learned and opportunities for improvement. Discussing the response of wheat yields to global warming and CO2 levels based on ecophysiological simulations, it also explores tools for parameter estimation, sensitivity analysis, and visualization. Assessing benefits and limitations, the text identifies key opportunities for iPlant, emphasizing the need for an open, modular framework and providing guidelines for success.

E N D
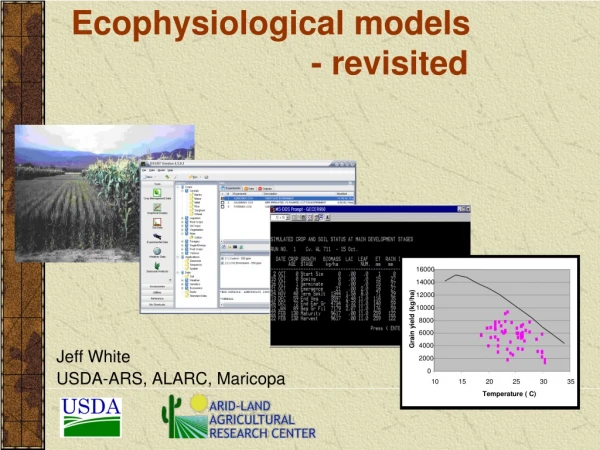
Ecophysiological models - revisited 16000 14000 12000 10000 Grain yield (kg/ha) 8000 6000 4000 2000 0 10 15 20 25 30 35 Temperature ( C) Jeff White USDA-ARS, ALARC, Maricopa
Objectives • Remind/inform people of basic capabilities of ecophysiological models and associated tools • Compare an existing model + software shell (DSSAT) to the iPlant G-to-P Modeling Workflow proposed by Steve • Show parallels between the two • Comment on lessons from a DSSAT-type approach • Identify opportunities for iPlant
Fourth Assessment Report of IPCC. Response of wheat yields (%) to global warming and elevated CO2 based on simulations with ecophysiological models. Elevated CO2 Ambient CO2
Simplified* flow diagram Initial inputs: start date, cultivar, soil, fertilizers … Management Water & N balance Daily inputs: weather, management, pests ... Phenology Photosynthesis Respiration Output Partitioning No Maturity? Final output Yes Senescence *CSM has > 270 routines
Relative effect of temperature on leaf photosynthesis for wheat. Source: P. Bindraban, 1997
Simulated vs observed growth of winter wheat at Manhattan, Kansas
DSSAT4.5 • Over 25 crop species • Large user base • 15+ years • Over 100 countries • Public and private sector • Numerous training events • Developed through collaboration among US and other universities, international centers, etc. • Partially supported through software license ($200 per copy) Other models & shells exist!
DSSAT4.5 is a shell • Dataset preparation • Runs cumpliant models such as Cropping Systems Model • Tools for model applications: • Parameter estimation • Cross-validation • Sensitivity analysis • Time series analysis • Spatial analysis
Two tools for sensitivity analysis:- Embedded in CSM model ( a legacy tool)- DSSAT Sensitivity Analysis V 4.5
Tools for visualization: - GBuild - EasyGrapher - Others incorporate graphics: weather, seasonal analysis, etc.
Simulated response of common bean to elevated temperature for 96 combinations of alleles at six loci
iPG2P proposed workflow compared to DSSAT Workflow boxes & DSSAT tools: Model entry Parameter estimation Sensitivity analysis Visualization of model inputs & outputs Verification Missing in workflow boxes: Weather data preparation Soil data preparation Management data preparation Cross-validation data preparation “Generic” applications: Time series Spatial Missing in DSSAT True modular model development Ability to import sub-models Applications for QTL & association mapping Links to genetic/genomic data
DSSAT4.5 • Positives • Widely used – “it works” • Promoted standardization of data • via the ICASA standards • Promoted use of systems approaches in research • Limitations • Models are only partially modular • Source code is not truly open • - Scares off contributors • - Painfully inefficient for software maintenance • Diverse GUIs for tools – confusing to users • One person maintains one tool – high risk for users • Tools have overlapping functionality – confusing to users • Incomplete documentation – confusing & frustrating • Main GUI is inefficient for many applications – more frustration
Key opportunities for iPG2P C.I. • Open, modular framework for modeling from pathway/organ scales to whole plant scale • Generic tools for: • Model development at different scales • Model evaluation • Dataset preparation – relates to data integration • Model applications • Parameter estimation • Time series analyses (e.g., multiple years or seasons) • Visualization is required throughout (and in numerous layouts) • G-to-P tools • Association and QTL mapping • Genetic data as inputs to models (parameter estimation) • Keys to success: • Open source – requires training for crop modeling community • Guidelines on “look and feel” or GUI • Learn from or adapt features of existing tools (not just DSSAT) • Tests cases that challenge multiple facets of the IPG2P C.I.