Download
1 / 30
300 likes | 567 Vues
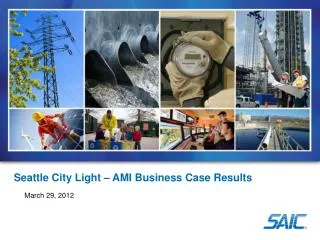
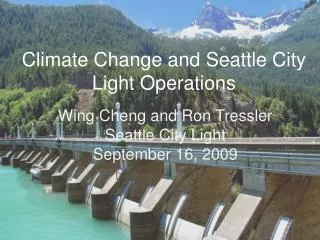
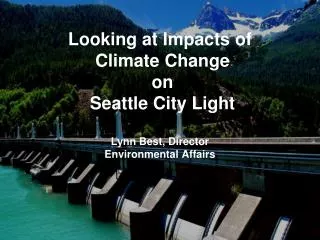
Looking at Impacts of Climate Change on Seattle City Light Lynn Best, Director Environmental Affairs. Seattle City Light. Municipal Electric Utility 395,000 customers About 90% of our power is hydro. Why Worry about Climate Change ?.

E N D
Looking at Impacts of Climate Change onSeattle City LightLynn Best, DirectorEnvironmental Affairs
Seattle City Light • Municipal Electric Utility • 395,000 customers • About 90% of our power is hydro
Why Worry about Climate Change ? • Started with a few staff in Power Planning and Power Operations • UW Study on NW climate Impacts • Nature of Our Business • Plan for the Long-Term • Assets Built for the Long-Term • Seattle Public Utilities (water and drainage) and Water Utility Climate Alliance
Impacts of Climate on Our System • Effect on hydrogenation • Load • Operations • Fisheries Resources • Infrastructure
City of Seattle Historical Observations • Last 20 years – 11% lower April-September Ross Inflows • 2 week earlier spring runoff since 1970 • More frequent and larger floods on the Sauk River
PDO Positive PDO Negative No official PDO Classification
City of Seattle Climate Change Historical Observations Earlier Runoff Note: Trends of runoffs shifting to earlier starts and ends
City of Seattle Climate Change Impacts Detected Increased Sauk River Flood Magnitude
City of Seattle Climate Change Historical Observations Increased Sauk River Flood Frequency
Modeling Analysis • Asked the Climate Impacts Group (CIG) for help • Downscaling GCMs • Site-specific Projections for the Skagit
City of Seattle Skagit Projections Provided by CIG • Snowpack and Monthly Stream flow at 9 Gages • Significant decline in snowpack (mean = 20%) • More flow in late-fall and winter • Lower summer flows • Extreme temperature and precipitation events • More warm wet days = greater flood potential • Weekly water temperature at selected river and stream sites • Substantial increases in summer water temperatures on Skagit River at Sedro Woolley and some eastside Ross Lake tributaries
City of Seattle Hydrologic Projections – Ross Basin Snow water equivalent (A1B) Stream flow (A1B) Temperatures warm Less snow accumulation & Earlier spring run-off Scenario Ensembles Ensemble Mean Historical Mean
City of Seattle Projected Number of Warm & Wet Days Warm, wet days increase significantly after mid 21st century, driven primarily by warmer temperatures (some precipitation)
Higher Flood Flows City of Seattle Extreme Flow Projections – Ross Reservoir Lower Summer Low Flows
Stream Temperature Projections Sedro Woolley Skagit at Sedro Woolley Skagit at Newhalem Stetattle Creek Stream temperature projections indicate some sites on the Skagit River will exceed thermal thresholds for core summer salmon habitat (16°C –WA Department of Ecology)
City of Seattle One Simulated Projection of A1B Climate Change Scenario Ross Reservoir Level • Operations Model • Monthly Flow Data • Reservoir refill by July 1 • Flood Control • Monthly instream flow requirements for fish • Optimized generation
Downstream Impacts to Salmonids 20-, 50- and 100-year floods increase Increased chance of spill Substantial decline in 7-day low-flow level Scouring of salmon redds Reduced salmonid survival
City of Seattle Concerns Will storm frequency and severity increase causing more spill and impacts to salmon?
City of Seattle Concerns Will glacier recession increase bedload deposition near mouths of tributaries? How will this affect generation and fish access?
Concerns How will Project need to be operated to provide adequate instream flow during August and September to protect fish from thermal barriers or direct injury/mortality
Future Work Adapt Operations in Response to: Changing precipitation seasonal trends Increased storms frequency and magnitude Lower summer flows New Federal Energy Regulatory Commission (FERC) license -- 2025 Corps of Engineers flood control management Improve Modeling and Linkage of Climate Change Projections with Operational Tools Explore use of Distributed Hydrology-Soil-Vegetation model (DHSVM) and dynamic downscaling techniques Improve understanding of tributary and glacier contribution Develop operations optimization model Operational constraints Scenarios and sensitivity analyses Daily time-step Protect Riverine Ecosystem, Endangered Species, and Anadromous Fish Assess Sea Level Rise Impacts