Exploring Linear Function Models PowerPoint Instructions
This PowerPoint guide is divided into three parts - Getting the data, Modelling the data, and Creating your data story. Part 1 guides you on accessing and selecting data from censusatschool.ca. Part 2 shows how to model the data using spreadsheet and statistics software, including creating dot plots and scatter plots. Part 3 teaches how to present your data story by copying data displays into your presentation software.

Exploring Linear Function Models PowerPoint Instructions
E N D
Presentation Transcript
Exploring Linear Function ModelsPowerPoint Instructions Part 1: Getting the data Part 2: Modelling the data Part 3: Creating your data story
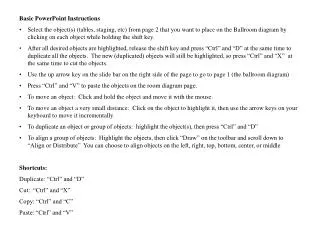
Open your web browser and type www.censusatschool.ca Click on Related sites
Click on the pull-down arrow and select Age 14. Type in 100 records. Type in your school’s name. Type in your name. Type in your e-mail address. Click on Submit Request.
Here is a summary of the data that will be sent to you via e-mail.
Use a spreadsheet program (such as QuattroPro or Excel) to open the file.
Open your statistics software program (such as Fathom) and select New Collection.
Left-click in your blank document and you will see Collection 1.
Drag the heightcmattribute over to the horizontal axis of your empty plot and let go.
Grab and drag the FootSizecm attribute over to the vertical axis of your plot and let go.
You now have a scatter plot, where each dot represents a person.
The brown line is the movable linethat you can fit to your data. Note the equation of your movable line.
The red line is your least-squares line. Note the equation of your least-squares line.
Double-click on any data point that looks interesting to you. The Inspect Collection window will show you all the information for that person.
The Edit Filter dialogue box appears. Filter out boys by typing in Gender = “F”. Click on OK.
You now see only girl cases. Note the filter, Gender = “F”,at the bottom of the scatter plot window.
To filter out the girls, first double-click on Gender = “F”.
Then type Gender = “M” in the Edit Filter dialogue box.
You now see only boy cases. Note the filter, Gender = “M”, at the bottom of the scatter plot window.
Now, filter out all students except those from the United Kingdom by typing Country = “UK” in the Edit Filter window.
You now see only United Kingdom cases. Note the filter, Country = “UK”,at the bottom of the scatter plot window.
To copy a data display, select it by clicking on or inside it.
Now, open your presentation software. Click on Edit and select Paste.
Your data display image should now be in your presentation software page, where you can resize and reposition it.