Download
1 / 46
460 likes | 550 Vues
Understand how Life Cycle Assessment (LCA) and sustainable metrics can shape the future of agriculture. Explore data-driven decision-making for efficient, environmentally friendly farming practices.

E N D
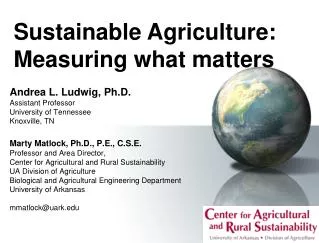
Sustainable Agriculture: Measuring what matters Andrea L. Ludwig, Ph.D.Assistant ProfessorUniversity of TennesseeKnoxville, TNMarty Matlock, Ph.D., P.E., C.S.E.Professor and Area Director, Center for Agricultural and Rural SustainabilityUA Division of AgricultureBiological and Agricultural Engineering DepartmentUniversity of Arkansasmmatlock@uark.edu
Sustainability 2050: The Challenge What we do in the next 10 years will shape Earth and Humanity for the next 100 years When technology and culture collide technology prevails, culture changes
We are all in this together Billions Less Developed Regions More Developed Regions Source: United Nations, World Population Prospects: The 2004 Revision (medium scenario), 2005.
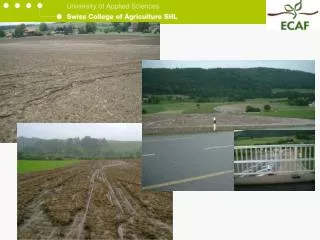
Human Activities Dominate Earth Croplands and pastures are the largest terrestrial biome, occupying over 40% of Earth’s land surface
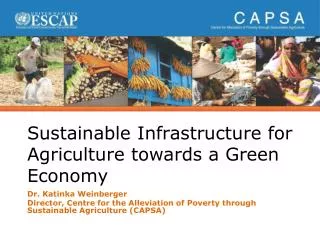
Meeting Food Needs by 2050 Jason Clay The role of research
Four Phases of a Life Cycle Assessment Life Cycle Assessment Framework Goal and Scope Definition Interpretation • Direct Applications: • Process Improvement • Product Assessment • Policy Analysis • Strategic Planning • Risk Management Inventory Analysis Impact Assessment
Emerging Consensus on LCA Framework for Ag Metrics for sustainability should be grounded in scientific methodologies such as Life Cycle Assessment Need comparable metrics that span sectors, industries and geographies LCA data (LCI) should be transparent, validated, widely available, inexpensive The same LCA data and models should be used by producers, retailers, policymakers, NGOs and consumers Sustainability Metrics, Indicators and Indices must be transparent
Life Cycle Analysis (LCA) to Understand and Manage Supply Chain Processes
LCA allows for impact assessment from cradle to grave Product 1 Raw Material A Raw Material B
LCA allows for impact assessment from cradle to grave Product 1 Raw Material A Raw Material B Boundaries matter
The biggest challenge for sustainable agriculture: DATA Or more specifically, lack of specific data We have to work with agricultural producers to insure we have data relevant to the decisions we need to make We need to understand the decisions we can make We must develop procedures for informing decisions that meet our common criteria
Life Cycle Assessment Allocation Kg CO2e per kg By Mass? By Value? + = + +
US Cotton Green House Gas LCA Carbon Emission (lb CE/acre) from Cotton Production from Fuel by Practice
Life Cycle Assessment Case Study:Carbon Equivalent GHG in Dairy Processing Production Distribution Consumption
Dairy Life Cycle Analysis to Reduce GHG Emissions Supply chain contribution to carbon footprint of fluid milk consumed in the U.S.
Field to Market Alliance • Field to Market is a collaborative stakeholder group of producers, agribusinesses, food and retail companies, and conservation organizations that are working together to develop a supply-chain system for agricultural sustainability. • We are developing outcomes-based metrics • We will measure the environmental, health, and socioeconomic impacts of agriculture first in the United States • We began with national scale environmental indicators for corn, soy, wheat, and cotton production in the U.S.
Definition of Sustainable Agriculture • Meeting the needs of the present while enhancing the ability of future generations to meet their needs • Increasing productivity to meet future food demands • Decreasing impacts on the environment • Improving human health • Improving the social and economic well-being of agricultural communities “Feeding 9.25 billion people without one hectare more of land or one drop more of water”
Environmental Indicator ReportCorn: Summary of Results Over the study period (1987-2007), • Productivity (yield per acre) has increased 41 percent. • Land use increased 21 percent. Land use per bushel decreased 37 percent. • Soil loss above T has decreased 43 percent per acre and 69 percent per bushel. • Irrigation water use per acre decreased four percent. Water use per bushel has been variable, with an average 27 percent decrease over the study period. • Energy use per acre increased three percent. Energy use per bushel decreased 37 percent. • Greenhouse gas emissions per acre increased eight percent. Emissions per bushel decreased 30 percent. • Total annual trends over this time period indicate increases in total annual energy use (28 percent), water use (17 percent), and greenhouse gas emissions (34 percent). Total annual soil loss has decreased 33 percent.
Environmental Indicator ReportCotton: Summary of Results Over the study period (1987-2007), • Productivity (yield per acre) increased 31 percent, with most improvement occurring in the second half of the study period. • Land use has fluctuated over time, with an overall increase of 19 percent. Land use per pound produced has decreased 25 percent. • Soil loss per acre decreased 11 percent while soil loss per pound decreased 34 percent. • Irrigation water use per acre decreased 32 percent, while water use per incremental pound of cotton produced (above that expected without irrigation) decreased by 49 percent. • Energy use per acre decreased 47 percent while energy use per pound decreased 66 percent. • Greenhouse gas emissions per acre decreased nine percent while emissions per pound fluctuated, with more recent improvements resulting in a 33 percent average decrease over the study period. • Total annual trends over the time period indicate soil loss and climate impact in 2007 are similar to the impact in 1987, with average trends over the study period remaining relatively flat. Total energy use decreased 45 percent and total water use decreased 26 percent.
Environmental Indicator ReportSoybeans: Summary of Results Productivity (yield per acre) increased steadily by 29 percent. Land use increased in absolute terms and by 31 percent while land use efficiency per bushel improved by 26 percent. Soil loss per acre decreased roughly 31 percent while soil loss per bushel decreased 49 percent. These trends coincide with significant changes in farming practices in states that grow the bulk of all soybeans. Irrigation water use per acre has changed little over time and water use per bushel improved 20 percent. However, only four to seven percent of the crop utilizes supplemental water. Energy use per acre has decreased 48 percent while per bushel energy use decreased 65 percent. Greenhouse gas emissions per acre declined 14 percent and emissions per bushel decreased 38 percent. Over the study period (1987-2007), Total annual trends over this time period indicate soybean production’s total energy use decreased 29 percent, total soil loss decreased 11 percent, total irrigation water use increased 39 percent, and climate impact increased 15 percent. 34
Over the study period (1987-2007), Productivity (yield per acre) increased by 19 percent. Land use decreased 24 percent. Land use per bushel was variable, with an average overall decrease of 17 percent. Soil loss per acre and per bushel improved 39 percent and 50 percent, respectively, with most improvements over the first half of the study period. Irrigation water use per acre increased 17 percent while water use per bushel produced due to irrigation showed an average flat trend. Energy use per acre increased eight percent and energy use per bushel decreased nine percent. Greenhouse gas emissions per acre increased 34 percent and emissions per bushel increased 15 percent, with a larger increase in the latter half of the study period. Environmental Indicator ReportWheat: Summary of Results Total annual trends over the twenty year study period showed an 18 percent decrease in total energy use and an 11 percent decrease in total water use. Total soil loss has decreased 54 percent. Total climate impact has increased an average of five percent over the study period, with a more significant increase over the past decade.
Dairy Farm Water Use: Context & Potential for Impact • Goal: Understanding the (geographical) hotspots for dairy operations with regard to water consumption and to place the dairy sector in the larger context of water consumption and availability
Mississippi Basin Nutrients Goal: Understanding the (geographical) hotspots for dairy operations with regard to nutrient impacts
“Leave the wood pile a bit taller than you found it.” - Frank Shell, 1974