Education Pays 2010
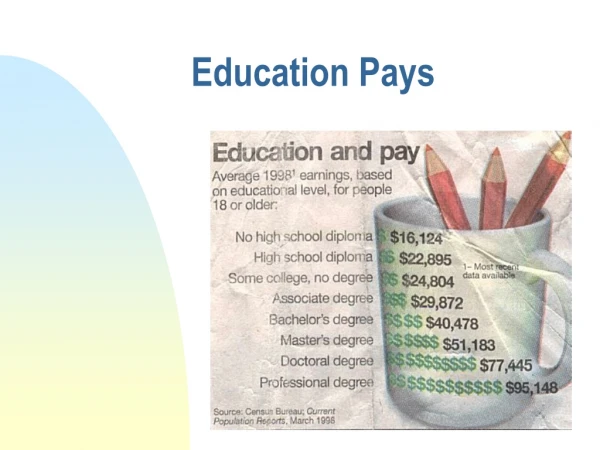
Trends in Higher Education Series. Education Pays 2010. The Benefits of Higher Education for Individuals and Society. Median Earnings and Tax Payments of Full-Time Year-Round Workers Ages 25 and Older, by Education Level, 2008.


Education Pays 2010
E N D
Presentation Transcript
Trends in Higher Education Series Education Pays2010 The Benefits of Higher Education for Individuals and Society
Median Earnings and Tax Payments of Full-Time Year-Round Workers Ages 25 and Older, by Education Level, 2008 Sources: The College Board, Education Pays 2010, Figure 1.1; U.S. Census Bureau, 2009; Internal Revenue Service, 2008; Davis et al., 2009; calculations by the authors.
Expected Lifetime Earnings Relative to High School Graduates, by Education Level Sources: The College Board, Education Pays 2010, Figure 1.2; U.S. Census Bureau, 2009; calculations by the authors.
Estimated Cumulative Earnings Net of Loan Repayment for Tuition and Fees, by Education Level Sources: The College Board, Education Pays 2010, Figure 1.3; U.S. Census Bureau, 2009; The College Board, 2009; calculations by the authors.
Median Earnings of Full-Time Year-Round Workers Ages 25–34, by Race/Ethnicity, Gender, and Education Level, 2008 Sources: The College Board, Education Pays 2010, Figure 1.4; U.S. Census Bureau, 2009; calculations by the authors.
Median, 25th Percentile, and 75th Percentile Earnings of Full-Time Year-Round Workers Ages 25 and Older, by Gender and Education Level, 2008 Sources: The College Board, Education Pays 2010, Figure 1.5; U.S. Census Bureau, 2009; calculations by the authors.
Median Earnings of Full-Time Year-Round Workers Ages 25–34, by Gender and Education Level, 1971–2008 (in Constant 2008 Dollars) Sources: The College Board, Education Pays 2010, Figure 1.6; National Center for Education Statistics, 2004; U.S. Census Bureau, 2003–2009; Bureau of Labor Statistics, 2010g; calculations by the authors.
College-to-High School Weekly Wage Premium, 1963–2008 Sources: The College Board, Education Pays 2010, Figure 1.7a; Autor, 2010.
Median Hourly Wage Gain per Year of Schooling, 1973, 1989, and 2007 Sources: The College Board, Education Pays 2010, Figure 1.7b; Autor, 2010.
Number of Employed Individuals Ages 25 and Older Relative to the First Quarter of 2007, by Education Level Sources: The College Board, Education Pays 2010, Figure 1.8a; Bureau of Labor Statistics, 2010b; calculations by the authors.
Labor Force Participation Rates Among Individuals Ages 25 and Older, by Gender and Education Level, First Quarter 2010 Sources: The College Board, Education Pays 2010, Figure 1.8b; Bureau of Labor Statistics, 2010e.
Job Satisfaction Rates Among Employed Individuals Ages 25 and Older, by Education Level, 2008 Sources: The College Board, Education Pays 2010, Figure 1.9a; National Opinion Research Center, 2008; calculations by the authors.
Importance Placed by Employed Individuals Ages 25 and Older on Feeling Work Is Important and Gives a Sense of Accomplishment, by Education Level, 2006 Sources: The College Board, Education Pays 2010, Figure 1.9b; National Opinion Research Center, 2006; calculations by the authors.
Unemployment Rates Among Individuals Ages 25 and Older, by Education Level, 1992–2009 Sources: The College Board, Education Pays 2010, Figure 1.10a; Bureau of Labor Statistics, 2010d.
Unemployment Rates of Individuals Ages 25 and Older, by Education Level and Race/Ethnicity, 2009 Sources: The College Board, Education Pays 2010, Figure 1.10b; Bureau of Labor Statistics, 2010c.
Estimated Reductions in Lifetime Public Expenditures per Person Associated with Increases in Educational Attainment, in 2010 Dollars Sources: The College Board, Education Pays 2010, Figure 1.11; Carroll and Erkut, 2009; calculations by the authors.
Employer-Provided Pension Plan Coverage Among Full-Time Year-Round Workers Ages 25 and Older, by Education Level, 2008 Sources: The College Board, Education Pays 2010, Figure 1.12a; U.S. Census Bureau, 2009; calculations by the authors.
Participation Rates in Employer-Provided Pension Plans Among Eligible Full-Time Year-Round Workers Ages 25 and Older, by Education Level, 2008 Sources: The College Board, Education Pays 2010, Figure 1.12b; U.S. Census Bureau, 2009; calculations by the authors.
Employer-Provided Health Insurance Coverage Among Private Sector Workers Ages 18 to 64 Working at Least Half-Time, by Education Level, 1979–2008 Sources: The College Board, Education Pays 2010, Figure 1.13; Economic Policy Institute, 2010.
Percentage of Individuals Ages 25 and Older Living in Households in Poverty, by Household Type and Education Level, 2008 Sources: The College Board, Education Pays 2010, Figure 1.14; U.S. Census Bureau, 2009; calculations by the authors.
Percentage of Individuals Ages 25 and Older Living in Households that Participated in Various Public Assistance Programs, by Education Level, 2008 Sources: The College Board, Education Pays 2010, Figure 1.15; U.S. Census Bureau, 2009; calculations by the authors.
Smoking Rates Among Individuals Ages 25 and Older, by Education Level, 1940–2008 Sources: The College Board, Education Pays 2010, Figure 1.16a; DeWalque, 2004; National Center for Health Statistics, 2009, Table 61; NCHS, 2008; calculations by the authors.
Distribution of Smoking Histories Among Individuals Ages 25 and Older, by Education Level, 2008 Sources: The College Board, Education Pays 2010, Figure 1.16b; NCHS, 2008; calculations by the authors.
Exercise Rates Among Individuals Ages 25 and Older, by Age and Education Level, 2008 Sources: The College Board, Education Pays 2010, Figure 1.17; National Center for Health Statistics, 2008; calculations by the authors.
Obesity Rates Among Adults Ages 25 and Older, by Age and Education Level, 2008 Sources: The College Board, Education Pays 2010, Figure 1.18a; National Center for Health Statistics, 2008; calculations by the authors.
Obesity Rates Among Children and Adolescents Ages 2 to 19, by Age and Highest Household Education Level, 2008 Sources: The College Board, Education Pays 2010, Figure 1.18b; National Center for Health Statistics, 2007–2008; CDC, 2010a; calculations by the authors.
Low-Birth-Weight Rates Among Babies Born to Mothers Ages 20 and Older, by Race/Ethnicity and Mother’s Education Level, 2006 Sources: The College Board, Education Pays 2010, Figure 1.19a; National Center for Health Statistics, 2009, Table 12.
Breast-Feeding Rates of Mothers of Babies Born from 2003 to 2006, by Duration and Education Level Sources: The College Board, Education Pays 2010, Figure 1.19b; Centers for Disease Control and Prevention, 2010b.
School Readiness of Preschool Children Ages 3–5, by Parents’ Highest Education Level, 2007 Sources: The College Board, Education Pays 2010, Figure 1.20a; National Center for Education Statistics, 2007; calculations by the authors.
Percentage of Kindergartners Through Fifth-Graders Whose Parents Reported Participating in Education-Related Activities with Their Children in the Past Month, by Parents’ Highest Education Level, 2007 Sources: The College Board, Education Pays 2010, Figure 1.20b; National Center for Education Statistics, 2009, Table 24.
Volunteering Rates Among Individuals Ages 25 and Older and Median Number of Hours Volunteered, by Education Level, 2009 Sources: The College Board, Education Pays 2010, Figure 1.21; Bureau of Labor Statistics, 2009f, Table 1 and Table 2.
Voting Rates Among U.S. Citizens, by Age and Education Level, 2008 Sources: The College Board, Education Pays 2010, Figure 1.22; U.S. Census Bureau, 2008.
Postsecondary Enrollment Rates of Recent High School Graduates by Family Income, 1984–2008 Sources: The College Board, Education Pays 2010, Figure 2.1; National Center for Education Statistics, 2010.
Postsecondary Enrollment Rates of Recent High School Graduates by Race/Ethnicity, 1975–2008 Sources: The College Board, Education Pays 2010, Figure 2.2a; National Center for Education Statistics, 2009, Table 201.
Postsecondary Enrollment Rates of All High School Graduates Ages 18 to 24, by Race/Ethnicity, 1975–2008 Sources: The College Board, Education Pays 2010, Figure 2.2b; National Center for Education Statistics, 2009, Table 204.
Postsecondary Enrollment Rates of Recent High School Graduates and of All 18- to 24-Year-Old High School Graduates by Gender, 1970–2008 Sources: The College Board, Education Pays 2010, Figure 2.3a; U.S. Census Bureau, 1970–2008.
Postsecondary Enrollment Rates of All Individuals Ages 18 to 34 by Age, 1970–2008 Sources: The College Board, Education Pays 2010, Figure 2.3b; NCES, 2009.
Dependent Students’ Postsecondary Sector by Family Income, 2007–08 Sources: The College Board, Education Pays 2010, Figure 2.4a; National Center for Education Statistics, 2008a.
Family Income Distribution of Dependent Students Within Postsecondary Sectors, 2007–08 Sources: The College Board, Education Pays 2010, Figure 2.4b; National Center for Education Statistics, 2008a.
Percentage of 1999 Entrants at Flagship Universities Graduating Within Six Years, by Parental Education Level and Family Income, Adjusted for Student Characteristics Sources: The College Board, Education Pays 2010, Figure 2.5a; Bowen et al., 2009.
Percentage of 1999 Entrants at North Carolina Public Universities Enrolling in Less-Selective Institutions than Those for Which They Were Eligible, by Socioeconomic Factors Sources: The College Board, Education Pays 2010, Figure 2.5b; Bowen et al., 2009.
Percentage of First-Time Full-Time Students Beginning Bachelor’s Degree Programs in 2002 Who Earned a B.A. at the Original Institution Within Four Years, Five Years, or Six Years, by Sector Sources: The College Board, Education Pays 2010, Figure 2.6a; National Center for Education Statistics, 2008b.
Percentage of First-Time Full-Time Students Beginning Bachelor’s Degree Programs in 2002 Who Earned a B.A. at the Original Institution Within Six Years, by Sector and Race/Ethnicity Sources: The College Board, Education Pays 2010, Figure 2.6b; National Center for Education Statistics, 2008b.
Education Level of Individuals Ages 25 to 34, 1940–2009 Sources: The College Board, Education Pays 2010, Figure 2.7; U.S. Census Bureau, 2009b, Table A-1.
Percentage of Individuals Ages 25 to 29 Who Have Completed High School, Some College or a Bachelor’s Degree, by Race/Ethnicity and Gender, 1973–2009 Black, non-Hispanic Hispanic White, non-Hispanic Sources: The College Board, Education Pays 2010, Figure 2.8; National Center for Education Statistics, 2007 and 2010.
Percentage of 1995–96 Beginning Postsecondary Students Who Studied and Earned Degrees in Science, Technology, Engineering, or Mathematics (STEM) Programs, by Gender and Race/Ethnicity Sources: The College Board, Education Pays 2010, Figure 2.9a; National Center for Education Statistics, 1996 and 2001; calculations by the authors.
Percentage of 1995–96 Beginning Postsecondary Students Who Studied and Earned Degrees in Science, Technology, Engineering, or Mathematics (STEM) Programs, by Citizenship Status, Parents’ Education Level, and Dependency Status Sources: The College Board, Education Pays 2010, Figure 2.9b; National Center for Education Statistics, 1996 and 2001; calculations by the authors.
Percentage of High School Graduates and of All Youths Enrolling in College Immediately After High School, Selected States, 2005–06 Sources: The College Board, Education Pays 2010, Figure 2.10; National Center for Education Statistics, 2009, Tables 105 and 203.
International Comparison of Percentage of Adults Ages 25–34 and 45–54 with at Least a Bachelor’s-Type Postsecondary Degree, Selected Countries, 2007 Sources: The College Board, Education Pays 2010, Figure 2.11; Organisation for Economic Co-operation and Development 2009, Table A1.3a.
References • Brand, Jenny, and Xie, Yu. (2010). “Evidence for Negative Selection in Heterogeneous Economic Returns to Higher Education.” American Sociological Review (April). • Bureau of Labor Statistics. (2010a). CPS Data: Employment Status. Household Data Annual Average.http://www.bls.gov/cps/cpsaat7.pdf. • Bureau of Labor Statistics. (2010b). CPS Data. Employment Status. Household Data Seasonally Adjusted Quarterly Data. http://www.bls.gov/web/empsit/cpseed3.pdf. • Bureau of Labor Statistics. (2010c). Employment Status. Household Data Annual Average. ftp://ftp.bls.gov/pub/special.requests/lf/aat7.txt. • Bureau of Labor Statistics. (2010d). Data Retrieval: Labor Force Statistics. Table A-4. http://www.bls.gov/webapps/legacy/cpsatab4.htm. • Bureau of Labor Statistics. (2010e). Labor Force Statistics from the Current Population Survey. http://data.bls.gov:8080/PDQ/outside.jsp?survey=ln. • Bureau of Labor Statistics. (2010f). Volunteering in the United States 2009. http://www.bls.gov/news.release/volun.nr0.htm. • Adelman, Clifford. (2009). The Spaces Between Numbers: Getting International Data on Higher Education Straight. Washington, DC: Institute for Higher Education Policy. • Alon, Sigal, and Tienda, Marta. (2005). “Assessing the Mismatch Hypothesis: Differences in College Graduation Rates by Institutional Selectivity.” Sociology of Education 78(4):294–315. • Autor, David. (2010). “The Polarization of Job Opportunities in the U.S. Labor Market: Implications for Employment and Earnings.” Center for American Progress and the Hamilton Project. • Bartick, Melissa, and Reinhold, Arnold. (2010). “The Burden of Suboptimal Breastfeeding in the United States: A Pediatric Cost Analysis.” Pediatrics. http://pediatrics.aappublications.org/cgi/content/abstract/peds.2009-1616v1. • Bowen, William G., Chingos, Matthew M., and McPherson, Michael S. (2009). Crossing the Finish Line: Completing College at America’s Public Universities. Princeton University Press.