Download
1 / 11
110 likes | 237 Vues
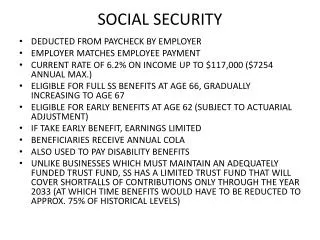
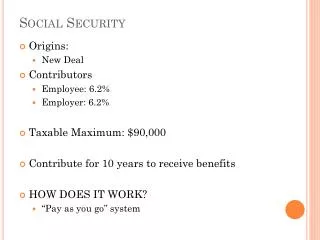
This overview explores the origins and functioning of Social Security, established during the New Deal era. With a "pay as you go" system, contributions come from employees and employers, each 6.2%, on a taxable maximum of $90,000. Benefits are available after ten years of contributions, supporting retirees, survivors, disabled individuals, and non-working spouses. As America’s population ages, challenges arise with fewer workers to support retirees. Proposed solutions include raising the taxable maximum and adjusting benefits to ensure program sustainability.

E N D
Social Security • Origins: • New Deal • Contributors • Employee: 6.2% • Employer: 6.2% • Taxable Maximum: $90,000 • Contribute for 10 years to receive benefits • HOW DOES IT WORK? • “Pay as you go” system
WHO GETS IT? • Recipients: • 62.8% Retired • 18.4% Survivor • Benefits • 13% Disabled • 5.8% Non working spouses
Social Security Trust Fund • Surplus goes into the trust fund • 2005: 1.7 trillion in trust fund • 155 billion added in 2005 • Government borrows • 150 billion a year (IOUs in fund)
Problems • Baby Boomers • Living longer • Fewer childbirths • 1945 • 42 workers/1 retiree • 2010 • 3 workers/1 retiree
America’s Population is AgingPopulation age 65 and Over Percentage of Population Aged 65 and Over Year Source: Social Security and Medicare Trustees’ Report, April 2007
Americans are living longer and having fewer children Consequently, fewer workers are available to support each Social Security recipient 2040: 2.1 to 1 Today: 3.3 to 1 1960: 5.1 to 1 Source: Social Security Administration, April 2007
Problem • 2015 Payouts exceed income • Need to tap into the trust fund • Govt. borrows $150 billion a year • 2037/2052: Trust Fund depleted • Annual collections only pay for 74% of benefits
Social Security and Medicare Part A Cumulative Cash Surpluses and DeficitsIn Constant 2007 Dollars—2007 through 2080 $708 Billion: Cumulative Social Security Cash Surplus -$26 Trillion: Cumulative Social Security Cash Deficits -$46 Trillion: Cumulative Medicare Part A Cash Deficits In Billions of Constant 2007 Dollars -72.3 Trillion: Cumulative Social Security and Medicare Part A Cash Deficits 2007 2010 2020 2030 2040 2050 2060 2070 2080 Calendar Year Source: Social Security Trustees’ Report—April 2007 (Intermediate Projections)
Medicare Costs Soar in the Coming Decades As a Percentage of GDP Calendar Year General Revenues required to fund the program Income from dedicated taxes, premiums, and state transfers Source: Medicare Trustees’ Report, 2007
Health Care Costs are Rising Faster Than the Economy All Federal Spending In Fiscal Year 2006 All Federal Revenues In Fiscal Year 2006 Percentage of GDP Year Assumes that health care cost growth continues at the average rate for the past 40 years (2.5 percentage points greater than GDP growth.) Assumes that health care cost growth rate declines to 1.0 percentage point greater than GDP growth—consistent with the assumption used by the Medicare Trustees. Source: Congressional Budget Office, December 2005.
Proposed Solutions • Raise Max level from $90,000 to $140,000 • Lower shortfall by 43% • Raise tax by ½% • Lower shortfall by 24% • Raise age 67-70 • Lower shortfall by 38% • Reduce benefits by 5% • Lowers shortfall by 26% • Lower benefits for high wage workers • Lowers shortfall by 14% • Put estate tax into Social Security Fund • Lowers shortfall by 75%