Training Data For Self Driving Cars
50 likes | 75 Vues
Training data for self driving cars is now possible with Anolytics that offers high-quality annotated datasets images and videos in 3D and 2D to make the AI perception model work with accurate results. It is providing a complete image annotation solution for all types of autonomous vehicle model training at affordable cost. It is expert in image annotation to make objects recognizable for computer vision in machines. <br>All types of image annotation services is offered by Anolytics to make the self-driving model training successful and accurate. Bounding Box, 3D Cuboid, Semantic Segmentation, 3D Point , Polygon and Polylines annotations are the leading types of annotation services offered here at Anolytics at affordable cost as per the customize needs. It is known for making the data more accurate while ensuring the privacy and safety of datasets. <br>

Training Data For Self Driving Cars
E N D
Presentation Transcript
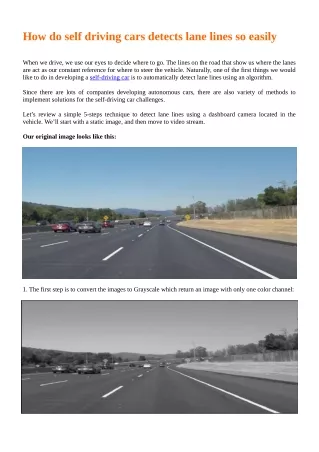
How do self driving cars detects lane lines so easily When we drive, we use our eyes to decide where to go. The lines on the road that show us where the lanes are act as our constant reference for where to steer the vehicle. Naturally, one of the first things we would like to do in developing a self-driving car is to automatically detect lane lines using an algorithm. Since there are lots of companies developing autonomous cars, there are also variety of methods to implement solutions for the self-driving car challenges. Let’s review a simple 5-steps technique to detect lane lines using a dashboard camera located in the vehicle. We’ll start with a static image, and then move to video stream. Our original image looks like this: 1. The first step is to convert the images to Grayscale which return an image with only one color channel:
2. Apply Gaussian smoothing which is essentially a way of suppressing noise and spurious gradients by averaging: 3. Apply Canny edge detection. The algorithm will first detect strong edge (strong gradient) pixels above the high_threshold, and reject pixels below the low_threshold. Next, pixels with values between the low_threshold and high_threshold will be included as long as they are connected to strong edges. The output edges is a binary image with white pixels tracing out the detected edges and black everywhere else: 4. Apply Hough Transform which gets the output from Canny and the result will be array of lines, containing the endpoints (x1, y1, x2, y2) of all line segments detected by the transform operation. Also, we need to determine ‘Region of interest’/ Region-Masking, to represent the vertices of a quadrilateral region that we would like to retain for the color selection, while masking everything else out.
5. Drawing the lines - In order to draw a single line on the left and right lanes, we need to create a function that get the Hough array (step 4 outputs) and perform the following: Separate the Hough array into two arrays, for the left and right lines, according to the slope (derived by the endpoints by using ((y2-y1)/(x2-x1))) Reject outliers slopes for each line according to a min and max values Calculate the mean slope for each line Extend the lines to fill all the slope, in this case I used simple multiplication with big negative and positive values (*400 and *(-400)) Calculate the mean of the new lines result with the previews lines (for the video streaming case) for better smoothing Draw lines with color and combine it with the original image In the above image we can observe how the function calculate the mean endpoints and slope for the left line (on blue) and for the right line (on green). Then the function extend the lines (the black lines) where
some of the endpoints exceeding the boundaries of the picture. The Region-Masking step (marked on yellow, the same as we used in the previous step) will cut the outliers edges, and the final output will be as smoother as it can. After processing this step on the Hough array (step 4) we will get the following image: That’s it! we have the original image with the lane lines detected and marked in red. Video streaming is just a collection of images. We can use video processing packages like "moviepy" to run the model steps on all the ‘images’ in the video. An output example for the streaming video can be found here A link to the project can be found here. The Jupyter notebook running with Python 3.5 along with the numpy and matplotlib libraries. I also used OpenCV ("Open-Source Computer Vision"), which is a package that has many useful tools for analyzing images, and "moviepy" package for video processing. Later I'll publish a follow-up post with more advanced techniques used to address the lane-lines challenge PH. No. : +1-516-342-5749 Email ID : info@anolytics.ai Thanks for reading, Anolytics