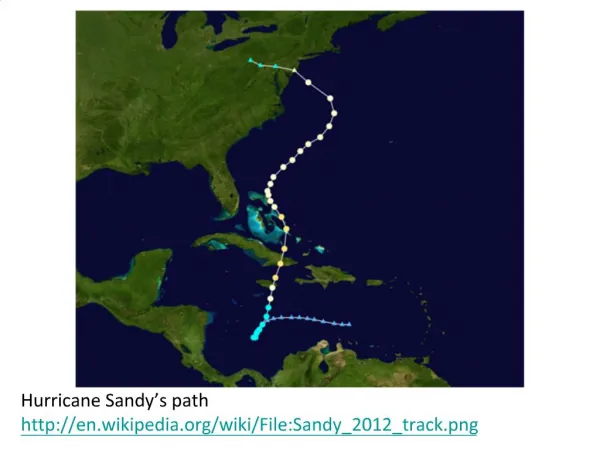
Quantifying Uncertainty Associated with Hurricane Path
110 likes | 134 Vues
This study investigates the potential of using evidence theory to evaluate the accuracy of hurricane predictions and develop an approach to improve forecasts. The uncertainty associated with hurricane paths is quantified using mathematical tools, and a test case is conducted using hurricanes from the year 2000. The results show promising potential for improving prediction accuracy.

Quantifying Uncertainty Associated with Hurricane Path
E N D
Presentation Transcript
Quantifying Uncertainty Associated with Hurricane Path Julie LETSCHERT, INSA LYON (Mentor: Svetlana POROSEVA, Florida State University)
A hurricane is an intensive tropical weather system with a well defined circulation that develops in the tropics. Several global numerical models provide analyses and forecasts of hurricanes. In forecasting hurricane paths the prediction accuracy is of vital importance. Yet, most current forecasts lack such information. • The objectives of the present study are • to investigate the potential of using evidence theory to evaluate the accuracy of hurricane predictions; • - to develop an approach that uses this information to improve forecasts.
Mathematical tools Uncertainty can be aleatory (due to stochastic influences and cannot be reduced) or epistemic (which originates from incomplete knowledge at any stage of modeling and simulation). Probability theory describes the aleatory uncertainty and possibility theory, for instance, describes the epistemic uncertainty. Evidence theory is the most developed of the theories that can handle both types of uncertainty.
Test case Hurricanes of year 2000. Models Global models from two operational centers: the European Center for Medium-Range Weather Forecasts model (ECMRWF) and the NOGAPS (Navy Operational Global Atmospheric Prediction System) forecast model.
Hurricanes of year 2000 Model ECMRWF Model NOGAPS (Several forecasts) First day forecast Second day forecast t=0 t=12h t=0 t=12h (t = 0, 12, 24, 36… hours) Latitude Longitude (2 variables)
Procedure 1rst step The forecast accuracy (deviation) is evaluated at each time by comparing model and observational data: Dev = Lo –Lm . Here, Lo is the value of observational latitude (longitude) and Lm is the model value. The deviation space (from - to +) is divided into intervals ΔDev. Then, we construct the support function, which provides the degree of support for each ΔDev: S(ΔDev)=n(ΔDev)/N, where n is the frequency with which Dev-values fall in ΔDev and N is the total number of data given for the time.
Model Hurricane number Dev 5 Obs 4 3 2 1 Latitude Support functions are NOT probability functions. For each time, 4 support functions are built (2 per model).
2nd step:Prediction. Intervals of possible true latitude/longitude values are assigned around the model value using the support functions built in the 1rst step. The support functions for the latitude and the longitude are multiplied to obtain the support of the area restricted by intervals in both directions. Model position (Lat, Lon)
3rd step Dempster’s rule is applied to combine areas of possible true latitude/longitude values predicted by the models. We apply the rule twice for each time with results from the 2 models (the 2 solutions are called R1 and R2).
4th step The 2 equally likely solutions R1 and R2 are combined so as to average the information they carry. The solution obtained, called R12, is compared to the observational path.
Conclusion: Observational data for three hurricanes from the South Pacific region, three hurricanes from the East pacific region, and six hurricanes from the West Pacific region are used for the evaluation of the quality of predictions obtained with the new technique. The results are encouraging. This approach can be applied to various problems.