Download
1 / 97
970 likes | 988 Vues
Explore the complexities of school finance in Wisconsin, including the reliance on property taxes, the concept of uniformity, and the state's role in providing financial assistance. Learn about revenue limits, state aids, exemptions, and the impact on tax levies.

E N D
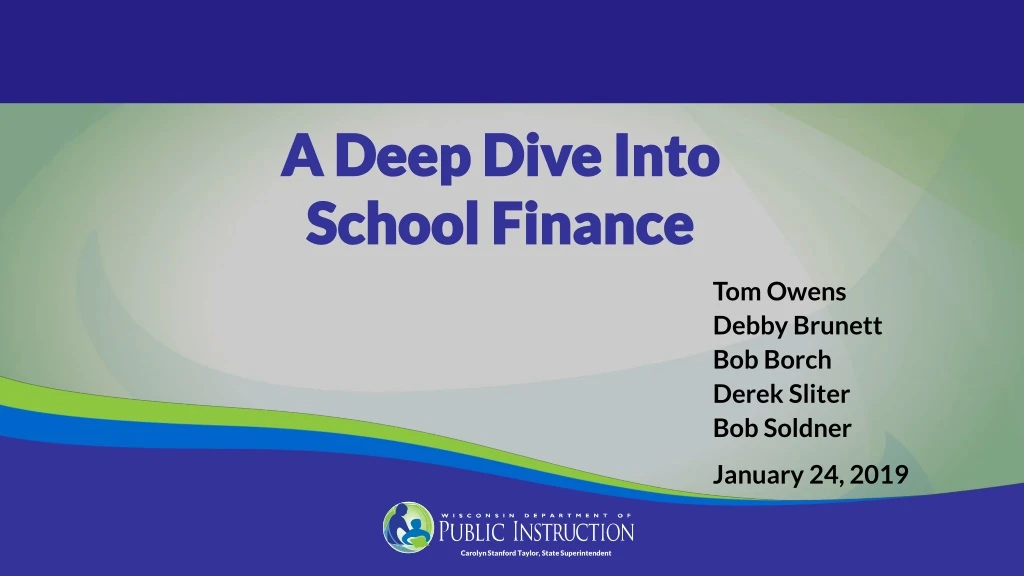
A Deep Dive Into School Finance Tom Owens Debby Brunett Bob Borch Derek Sliter Bob Soldner January 24, 2019 Carolyn Stanford Taylor, State Superintendent
U.S. Constitution on Education – Education is a State Function 10th Amendment “…powers not granted to the federal government by the Constitution, nor prohibited to the States, are reserved to the States or the people…” 1791
Wisconsin Constitution on Education Article X, Section 2 “The legislature shall provide by law for the establishment of district schools, which shall be as nearly uniform as practicable; and such schools shall be free and without charge for tuition to all children between the ages of 4 and 20.” 1848
Wisconsin Constitution on Education Article X, Section 4 “Each town and city shall be required to raise by tax, annually, for the support of common schools therein……” 1848
Basic Framework - What We Know So Far State Responsibility District Schools As Nearly Uniform as Practicable Free Funded by Local Property Tax
Modern-Day Wisconsin In Wisconsin, the primary funding source for public schools is the property tax, but we know that property values across the state are not uniform. The challenge is defining “uniform as practicable.”
Wisconsin Supreme Court Uniformity goes to the “character of education,” not to the total amount spent. However, funding “character” cannot result in too great of a disparity of cash.
Wisconsin Constitution on Education Article X, Section 2 “The legislature shall provide by law for the establishment of district schools, which shall be as nearly uniform as practicable; and such schools shall be free and without charge for tuition to all children between the ages of 4 and 20.” A child should not be unfairly disadvantaged merely by where they live.
Constitutional Underpinnings The State provides financial assistance in the form of Equalization/General Aid to school districts in order to: Reduce the reliance upon the local property tax as the sole source of revenue for educational programs. Guarantee that a basic educational opportunity is available to all pupils regardless of the local fiscal capacity of the district in which they reside.
Revenue Limits, State Aids, and Controlled Property Tax Levies
State Totals - School District Revenues CONTROLLED Although the mix of aid and taxes may be different across districts, the Revenue Limit can control 70-90% of the General Fund budget!
Per Member Increase The legislature has the authority to set the per member increase. Originally, they based it on the annual percentage change in the consumer price index (CPI) for all urban consumers, US city average. Recent years have been flat dollar amounts, zero, & even reductions. The per member increase range was as low as -$532.00 in 2011-12 and as high as $274.68 in 2008-09. For 2015-16, 2016-17, 2017-18, and 2018-19 the legislature has set the increment at $0.00.
Low Revenue Ceiling With specific limitations tied to successful referenda to exceed revenue limits, 2017 Wisconsin Act 141 has increased the low revenue ceiling per member to: • $9,400 in 2018-19 • $9,500 in 2019-20 • $9,600 in 2020-21 • $9,700 in 2021-22 • $9,800 for 2022-23 and any subsequent year
Recurring Exemptions • Once a district levies for a Recurring Exemption, that amount stays permanently in the base going forward. 2018-19 Revenue Limit 2017-18 Revenue Limit Recurring Referendum New Year Base Includes All $$$ Recurring Exemptions Levied in Prior Year Transfer of Service Aid + Levy Base Prior Year Carryover Base 15
Non-Recurring Exemptions • The exemption is only valid for a limited period of time – usually one Revenue Limit cycle. 2018-19 Revenue Limit 2017-18 Revenue Limit Non-Recurring Referendum Declining Enrollment Aid + Levy Adjustment for new Choice Students Base Base Base Will Include Levied Recurring Authority from the Prior Year 15 15
District Specific Revenue Limit Data Prepopulated and Executable Revenue Limit worksheets • https://dpi.wi.gov/sfs/limits/worksheets/revenue Longitudinal data related to Revenue Limits • https://dpi.wi.gov/sfs/statistical/longitudinal-data/revenue-limit
Revenue Limit Per Member with Exemptions Lowest $9,200 Highest $21,566 State Average $10,524 $10,700 $18,000 $9,700 $11,700 $16,700 $15,700 $14,700 $13,700 $12,700 Source: Department of Public Instruction
Basic Revenue Limit Concepts The Revenue Limit controls income from general state aid and local property tax revenues. Revenue Limits are calculated by multiplying the Membership * a Per Member dollar amount – and adding on any exemptions. Most districts are not restrained by their initial calculation but are eligible for various exemptions to increase their Revenue Limit. Exemptions result in additional taxation. It is very important to know the difference between recurring and non-recurring exemptions. This is especially true when planning a referendum. Calculating the property tax levy is a direct result of completing the Revenue Limit calculation.
Revenue Limit Questions?
Property Value and Fiscal Capacity A student should not be unfairly disadvantaged as a result of where he or she lives. Property Tax Base This example is for hypothetical purposes only
Formula Equalizes Revenue to Mitigate Differences Equalization Aid Property Tax Base This example is for hypothetical purposes only
Incorporating the Number of Children to Educate $1,000,000 $2,000,000 $3,000,000 $4,000,000 $5,000,000 10 10 10 10 10 $400,000 $100,000 $200,000 $300,000 $500,000 The tax base, as a measure of fiscal capacity (wealth), changes after incorporating the number of children to educate. This example is for hypothetical purposes only
Incorporating the Number of Children to Educate $1,000,000 $2,000,000 $3,000,000 $4,000,000 $5,000,000 10 10 5 6 20 $400,000 $100,000 $400,000 $500,000 $250,000 Notice how the tax base, as a measure of fiscal capacity (wealth), changes after incorporating the number of children to educate. This example is for hypothetical purposes only
Property Value Per Member Source: Department of Public Instruction
Key Local Factors Membership converts variables to per-pupil $s.
Factor: Equalized Property Value Property tax base is used to determine district wealth and ability to support district expenditures. Uses Equalized Valuation or Fair Market Value. (NOT Assessed Value) Property values for each district are certified in May each year by the WI Departmentof Revenue and used in the subsequent year’s aid calculations.
Who is counted for aid membership? Generally, residents for which you are financiallyresponsible - i.e. you are paying for the student’s education. Is a “process” to help districts determine who qualifies. Start with who is in your seats on the count date. Factor: Membership Revenue Limit membership is not the same as General Aid membership. State law defines.
Factor: Membership This example is for hypothetical purposes only September and Summer Membership Included in Revenue Limit 3-Year Average Calculations
Factor: Membership This example is for hypothetical purposes only
Factor: Spending (Shared Cost) A district gets all types of revenue to fund their educational programs: • Local Property Tax • State Equalization Aid • State Categorical Aid (transportation, library, bilingual aids) • Federal Aid (Title Programs, IDEA) • State Grants • Fees (be careful with what fees you charge)
General Fund Shared Cost This example is for hypothetical purposes only
State “shares” in district costs funded by state aid and local levy. $1 in debt service costs is treated the same as $1 in teacher salaries. Aid is based on a district’s ability to fund expenditures, as measured by its property wealth per member. Equalization Aid Basic premise: The more property wealth per member a district has, the less equalization aid it will receive…….and vice versa.
Equalization Aid What determines how much aid a district receives?
Equalization Aid The aid computation is actually 3 individual computations……. The results of all 3 are summed to get the district’s total Equalization Aid.
Equalization Aid – District #1 District Value per Member Positive Primary Aid 10% 90%
Sample District #1 (per-member)
Equalization Aid – District #2 District Value per Member 30% 70% Positive Primary Aid
Sample District #2 (Higher Property Value) (per-member)
Equalization Aid – District #1 District Value per Member 25% 75% Positive Secondary Aid 10% Positive Primary Aid 90%
Equalization Aid – District #1 District Value per Member Positive Tertiary Aid 50% 50% Secondary Cost Ceiling 25% 75% Positive Secondary Aid Primary Cost Ceiling 10% 90% Positive Primary Aid
Sample District #1 (per-member) Total Shared Cost = $6,000,000 (500 x $12,000) Tax Base = $3,600 State Aid = $8,400 X 500 membership Tax Base = $1,800,000 State Aid = $4,200,000
Equalization Aid – District #2 District Value per Member 75% 25% Positive Secondary Aid Positive Primary Aid 30% 70%
Sample District #2 (Higher Property Value) (per-member)
Equalization Aid – District #2 District Value per Member $600,000/$400,000 = 150% Positive Tertiary Aid 150% -50% Negative Tertiary Aid 75% 25% Positive Secondary Aid Positive Primary Aid 30% 70%