Download
1 / 26
260 likes | 360 Vues
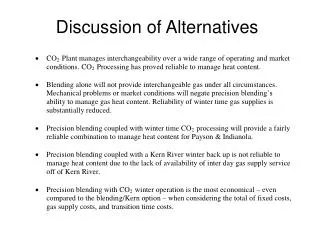
This presentation discusses the cleanup alternatives for the Lower Passaic River, focusing on the Diamond Alkali site which has been a Superfund site since 1984. It highlights the need for a sustainable remedy that addresses the entire ecosystem while considering community impacts. The presentation outlines two primary alternatives for remediation: deep dredging and a dredge-and-cap approach, emphasizing the benefits of targeted remediation to reduce contaminant risks effectively. Conclusions drawn from region-specific assumptions and adaptive management strategies are also presented.

E N D
Discussion of Lower Passaic Cleanup Alternatives Presentation to the Fair Lawn Environmental Commission April 3, 2013 1
Presentation Elements • History of the Diamond Alkali site • Overview of Sustainable Remedy • Discussion of Region 2’s FFS assumptions • Description of targeted remediation and watershed improvement projects • Why use the targeted approach? • Conclusions 2
History of the Diamond Alkali site • In 1984, the EPA added the Diamond Alkali site to the Superfund National Priorities list. • The site is composed of former manufacturing operations at 80 and 120 Lister Avenue, the Newark Bay Study Area and the Lower Passaic River Study Area. • Occidental and related parties were found to be potentially responsible for the cleanup. • The Occidental parties are not members of the Lower Passaic River Study Area Cooperating Parties Group (CPG). 3
Goals for the River • Improve the quality of the River as quickly as possible • Use techniques that have the best chance for success and have been proven effective. • Minimize impacts and provide value to neighboring communities 4
A Sustainable Remedy • Needs to address the entire 17-mile ecosystem • Consists of: • Targeted remediation of highest surface sediment contamination followed by review of actual, measured results • Projects such as wetlands restoration, storm water reduction initiatives and efforts to improve access and usability 5
Current Region 2 FFS • Two alternatives under consideration: • Deep Dredge – remove all sediments from RM 0-8 • Dredge and Cap – remove surface sediments and install cap in RM 0-8 • Region 2 assumes this can be completed in 6-11 years • Does not address RM 9-17 6
Assumptions Made in the Region 2 FFS • Dredging can be accomplished much faster than experience suggests • Sediments can be removed from a section of River with virtually no recontamination from adjoining areas up and downstream • Natural recovery rates observed in recent years will not continue 7
RM 10.9 Data Clearly Illustrates Ability to Reduce Potential Risk with Targeted Removal • 2,3,7,8 TCDD Removal Area is well defined by 1000 ppt contour: • In fine sediment near shore in central to upriver portion of inside river bend • Rapid decline of concentrations outside of silt deposit • Deeper sediment is stable as documented by radiodating • TCDD co-located with other COCs (especially those with the highest concentrations such as PCBs and mercury) • Targeted remediation of high concentration area provides significant overall risk reduction 9
Bounded by river channel and adjacent samples Bounded by river channel and adjacent samples Developing Target Areas: Example at RM 7-7.8 10
Proposed Targeted Areas Elevated TCDD and other COCs are generally co-located As per Adaptive Management, ongoing delineation and monitoring will be used to refine areas Will reduce surface concentrations of TCDDs by 80% and bring PCBs to background levels 11
Comparison with FFS % Reduction vs. Time Unprecedented Dredging Rates Percent TCDD Remaining 100% 90% 80% 70% 60% 50% 40% 30% 20% 10% 0% • Dredging projects in less urbanized river systems have rarely achieved assumed rates: • Hudson: 363,000 cy in 2011 and about 650,000 cy in 2012 • Fox River: about 500,000 cy/yr • The removal rate for the Tierra Phase 1 project equates to about 120,000 cy/yr • Engineers estimate FFS to take 17 to 28 years to complete under optimal conditions FFS Dredge and Cap FFS Deep Dredge Targeted Remedy | | | | | | | | | | | | | | | | | | | | | | | | | | | | | | | | | | | | | | | | | | | | | | | | | | 0 5 10 15 20 25 30 35 40 45 50 Year on the River 12
Comparison with FFS % Reduction vs. Time Percent TCDD Remaining 100% 90% 80% 70% 60% 50% 40% 30% 20% 10% 0% More Likely Dredging Rates Dredging is Sloppy Work • Up to 6% of sediment dredged is lost to the river • The more sediment dredged the more that will be lost • Targeted areas can be controlled better so less sediment is lost FFS Deep Dredge FFS Dredge and Cap Targeted Remedy | | | | | | | | | | | | | | | | | | | | | | | | | | | | | | | | | | | | | | | | | | | | | | | | | | 0 5 10 15 20 25 30 35 40 45 50 Year on the River 13
Comparison with FFS % Reduction vs. Time Percent TCDD Remaining 100% 90% 80% 70% 60% 50% 40% 30% 20% 10% 0% Effect of loss of sediment during dredging FFS Deep Dredge Will lose the most sediment Targeted Remedy Will lose less sediment FFS Dredge and Cap | | | | | | | | | | | | | | | | | | | | | | | | | | | | | | | | | | | | | | | | | | | | | | | | | | 0 5 10 15 20 25 30 35 40 45 50 Year on the River 14
Comparison with FFS % Reduction vs. Time Percent TCDD Remaining 100% 90% 80% 70% 60% 50% 40% 30% 20% 10% 0% Effect of background on results of dredging FFS Dredge and Cap The cap will be recontaminated FFS Deep Dredge Channels will be filled with background sediment Targeted Remedy Will be less affected because it works with the river | | | | | | | | | | | | | | | | | | | | | | | | | | | | | | | | | | | | | | | | | | | | | | | | | | 0 5 10 15 20 25 30 35 40 45 50 Year on the River 15
Recontamination of Caps • Contamination Remains Upstream and Downstream of the Remediated Area for Region 2’s Alternatives Average Surface Sediment 2,3,7,8-TCDD (ppt) As predicted by EPA 16
What Happens After Region 2’s FFS Dredging? • 40% reduction in contaminant concentration in 12 years (3% per year) • Same reduction rate seen in fish tissue • fish tissue 17
Nothing Has Changed • Bathymetry shows the river is working the same way • Recovery will continue • With the high concentration area removed the rate of recovery may increase 18
Comparison with FFS % Reduction vs. Time Percent TCDD Remaining 100% 90% 80% 70% 60% 50% 40% 30% 20% 10% 0% Natural Recovery Continues • After Source Removal • Recovery continues at 3% FFS Deep Dredge FFS Dredge and Cap Targeted Remedy | | | | | | | | | | | | | | | | | | | | | | | | | | | | | | | | | | | | | | | | | | | | | | | | | | 0 5 10 15 20 25 30 35 40 45 50 Year on the River 19
Comparison with FFS % Reduction vs. Time Percent TCDD Remaining 100% 90% 80% 70% 60% 50% 40% 30% 20% 10% 0% Natural Recovery May Increase • After Source Removal • If the recovery rate increases to 5% per year all results are equal FFS Deep Dredge FFS Dredge and Cap Targeted Remedy | | | | | | | | | | | | | | | | | | | | | | | | | | | | | | | | | | | | | | | | | | | | | | | | | | 0 5 10 15 20 25 30 35 40 45 50 Year on the River 20
Comparison with FFS % Reduction vs. Time Percent TCDD Remaining 100% 90% 80% 70% 60% 50% 40% 30% 20% 10% 0% FFS Dredge and Cap • The Difference • Quicker risk reduction will result in a better river FFS Deep Dredge Targeted Remedy | | | | | | | | | | | | | | | | | | | | | | | | | | | | | | | | | | | | | | | | | | | | | | | | | | 0 5 10 15 20 25 30 35 40 45 50 Year on the River 21
Information to measure success and support future decision-making • Post-remedy monitoring to measure effectiveness • Fish tissue • Ecology • Bathymetry • Need to demonstrate success to EPA and stakeholders 22
Monitoring data will let us answer these important questions • Have levels in fish tissue declined? • Have the caps remained intact? • Is remaining river sediment stable? • Is ecology improving? Unless the answers are “YES”, more work will need to be done 23
Out-of-River Component • Focuses on RM 0-17 • Addresses ongoing contamination and “urban river” water quality issues • Includes projects, such as wetlands restoration, steps to reduce urban runoff, new parks, and improved access points with input from River communities 24
Conclusions – Sustainable Remedy • Consistent with EPA Guidance • Considers all available data • Achieves significant risk reduction faster • Removes high concentration areas • Minimizes re-suspension of COCs • Significantly reduces duration/disturbance of River • Enhances the natural recovery rates of the River • Uses measured data to evaluate performance • Reduces ongoing contamination through out-of-river projects 25
Questions? 26