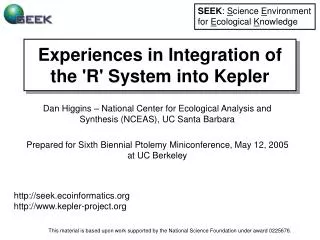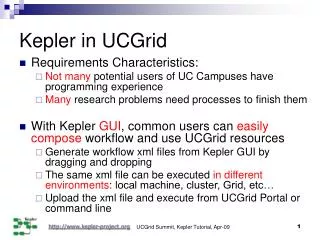
Using R in Kepler
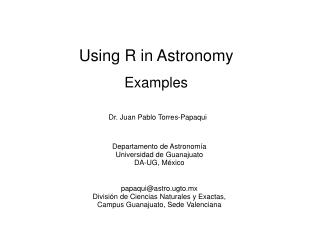
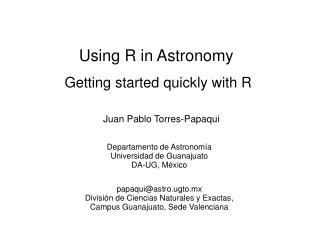
Using R in Kepler. Dan Higgins – NCEAS Prepared for: Ecoinformatics Training for Ecologists LTER (Albuquerque) January 8-12, 2007 http://www.kepler-project.org. What is R?. R is a language and environment for data manipulation, statistical computing, and graphics.

Using R in Kepler
E N D
Presentation Transcript
Using R in Kepler Dan Higgins – NCEAS Prepared for: Ecoinformatics Training for Ecologists LTER (Albuquerque) January 8-12, 2007 http://www.kepler-project.org
What is R? • R is a language and environment for data manipulation, statistical computing, and graphics. • R is open-source and thus can be freely downloaded and used at no cost • The R Project for Statistical Computing • http://www.r-project.org/ • NCEAS R Programming Language Resource Center • http://www.nceas.ucsb.edu/scicomp/RProgTutorialsLatest.html • http://www.nceas.ucsb.edu/scicomp/RShortCourse.html
R Example With only 3 lines, one can read a data table, plot all combinations of column data, and summarize the data
Kepler and R • R language has many similarities to the Kepler expression language • R language emphasizes operations on vectors, matrices, and tables (‘data frames’) rather than scalars. (This eliminates many explicit looping statements) • Many detailed statistical operations and data manipulation routines already exist in R • R has ability to create sophisticated graphic displays • Being able to call R routines from Kepler greatly simplifies many workflows
Simple R Workflow Just drag an RExpression actor to the work area, add a director, and connect the outputs to a display and imageJ actors Display is the same as one sees running the R script from the command line
Arrays and Graphical Output R Script: ccc <- aaa + bbb ccc plot(aaa,bbb) Adding ports automatically creates R objects with the port name [e.g. aaa <- c(1,2,3,4)] Graphics automatically saved as images and sent to ‘graphicsFileName’ output port (as file name) R text output automatically sent to ‘output’ port
RExpression – Ports & Parameters Adding ports creates R objects from Kepler tokens R script is a parameter of the RExpression actor which uses port names
Array Records and Data Frames Tables are represented as ‘Data Frame’ objects in ‘R’ A Ptolemy ‘Record of Arrays’ can also represent a table R Script: summary(df) where ‘df’ is the R dataframe created automatically when a record of arrays is passed to an input port
R Dataframes AAA <- c(“one”,”two”,”three”,”four”) BBB <- c(1,2,3,4) df <- data.frame(aaa,bbb) Creating a dataframe df In R, a ‘dataframe’ represents a table A dataframe is a list of column vectors Each column has the same kind of data (e.g. a number or a string) Each column can have a name (e.g. ‘AAA’ or ‘BBB’ ) 1st Column: df[1,], df[‘AAA’,] 2nd Row: df[,2], df[AAA==‘two’,] Selecting Parts of a dataframe
Configuring an EML Datasourcefor Use in RExpression Use “As Column Vector” to pass the entire column at one time (i.e. an R vector)
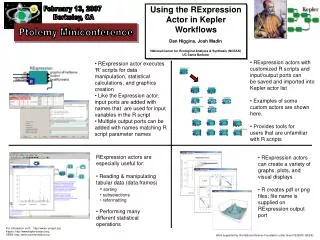
Custom RExpression Actors RExpression actors with pre-built R scripts can be added to the Kepler actor list. Examples of current customs actors are shown here. This provides tools for users that are unfamiliar with R scripts
Acknowledgements • This material is based upon work supported by: • The National Science Foundation under Grant Numbers 9980154, 9904777, 0131178, 9905838, 0129792, and 0225676. • Collaborators: NCEAS (UC Santa Barbara), University of New Mexico (Long Term Ecological Research Network Office), San Diego Supercomputer Center, University of Kansas (Center for Biodiversity Research), University of Vermont, University of North Carolina, Napier University, Arizona State University, UC Davis • The National Center for Ecological Analysis and Synthesis, a Center funded by NSF (Grant Number 0072909), the University of California, and the UC Santa Barbara campus. • The Andrew W. Mellon Foundation. • Kepler contributors: SEEK, Ptolemy II, SDM/SciDAC, GEON