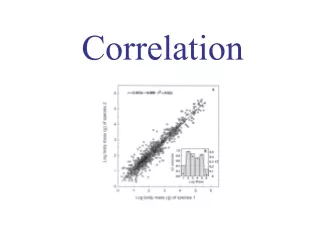
Correlation
2. Additional Reading. For additional reading see Chapter 6 in Michael R. Middleton's Data Analysis Using Excel, Duxbury Thompson Publishers, 2000.See also Chapter 4 section 7 of Keller and Warrack's Statistics for Management and Economics. Fifth Edition, Duxbury Thompson Learning Publisher, 2000.


Correlation
E N D
Presentation Transcript
1. Correlation Farrokh Alemi, Ph.D.
Kashif Haqqi M.D.
2. 2 Additional Reading For additional reading see Chapter 6 in Michael R. Middleton�s Data Analysis Using Excel, Duxbury Thompson Publishers, 2000.
See also Chapter 4 section 7 of Keller and Warrack�s Statistics for Management and Economics. Fifth Edition, Duxbury Thompson Learning Publisher, 2000.
Read any introductory statistics book about correlation.
3. 3 Which Approach Is Appropriate When? Choosing the right method for the data is the key statistical expertise that you need to have.
You might want to review a decision tool that we have organized for you to help you in choosing the right statistical method.
4. 4 Do I Need to Know the Formulas? You do not need to know exact formulas.
You do need to know where they are in your reference book.
You do need to understand the concept behind them and the general statistical concepts imbedded in the use of the formulas.
You do not need to be able to do correlation and regression by hand. You must be able to do it on a computer using Excel or other software.
5. 5 Table of Content Objectives
Independent and dependent variables
Example
Scatter plot
Correlation coefficient
Range of correlation coefficient
Formula for correlation coefficient
Example for correlation coefficient
Possible relationships between variables
6. 6 Objectives To learn the assumptions behind and the interpretation of correlation.
To use Excel to calculate correlations.
7. Purpose of Correlation Correlation determines whether values of one variable are related to another.
8. 8 Independent and Dependent Variables Independent variable: is a variable that can be controlled or manipulated.
Dependent variable: is a variable that cannot be controlled or manipulated. Its values are predicted from the independent variable.
9. 9 Example Independent variable in this example is the number of hours studied.
The grade the student receives is a dependent variable.
The grade student receives depend upon the number of hours he or she will study.
Are these two variables related?
10. 10 Scatter Plot The independent and dependent can be plotted on a graph called a scatter plot.
By convention, the independent variable is plotted on the horizontal x-axis. The dependent variable is plotted on the vertical y-axis.
11. 11 Example of Scatter Plot A scatter plot is a graph of the ordered pairs (x,y) of numbers consisting of the independent variables, x, and the dependent variables, y.
Please use excel to create a scatter plot.
12. 12 Interpret a Scatter Plot
The graph suggests a positive relationship between hours of studies and grades
13. 13 Correlation Coefficient The correlation coefficient computed from the sample data measures the strength and direction of a relationship between two variables.
The range of the correlation coefficient is.
- 1 to + 1 and is identified by r.
14. 14 Positive and Negative Correlations A positive relationship exists when both variables increase or decrease at the same time. (Weight and height).
A negative relationship exist when one variable increases and the other variable decreases or vice versa. (Strength and age).
15. 15 Range of correlation coefficient In case of exact positive linear relationship the value of r is +1.
In case of a strong positive linear relationship, the value of r will be close to + 1.
16. 16 Range of correlation coefficient In case of exact negative linear relationship the value of r is �1.
In case of a strong negative linear relationship, the value of r will be close to � 1.
17. 17 Range of correlation coefficient
In case of a weak relationship the value of r will be close to 0.
18. 18 Range of correlation coefficient
In case of nonlinear relationship the value of r will be close to 0.
19. 19 Formula for correlation coefficient The formula to compute a correlation coefficient is:
r = [n(?xy) � (?x)(?y)] /
{[n(?x2) � (?x)2][n(?y2) � (?y)2]}0.5
Where n is the number of data pairs, x is the independent variable and y the dependent variable.
20. 20 Example for correlation coefficient Let�s do an example.
Using the data on age and blood pressure, let�s calculate the ?x, ?y, ?xy, ?x2 and ?y2.
21. 21 Example for correlation coefficient Substitute in the formula and solve for r:
r= {(6*47634)-(345*819)}/{[(6*20399)-3452][(6*112443)-8192]}0.5.
r= 0.897.
The correlation coefficient suggests a strong positive relationship between age and blood pressure.
22. 22 Possible Relationships Between Variables Direct cause and effect, that is x cause y or water causes plant to grow.
Both cause and effect, that y cause x or coffee consumption causes nervousness as well nervous people have more coffee.
Relationship caused by third variable; Death due to drowning and soft drink consumption during summer. Both variables are related to heat and humidity (third variable).
23. 23 Possible Relationships Between Variables Complexity of interrelationships among many variables; Relationship between student�s high school grade and college grades. But others variables are involved too such as IQ, hours of study, influence of parents, motivation, age, and instructors.
Coincidental relationship; Increase in the number of people exercising and increase in the number of people committing crimes.
24. 24 Interpretation The correlation is 0.9
There is a strong positive relationship between age and blood pressure
25. 25 Test of Correlation Null hypothesis: correlation is zero
Test statistic is t = r [(n-2)/(1-r2)]0.5
The statistic is distributed as Student t distribution with n-2 degrees of freedom
Excel does not calculate this statistic and you can manually calculate it
26. 26 Take Home Lesson Correlation measures association and not causation.
Correlation assumes linear relationship.
Values range between �1 and +1 and measure the strength and direction of the relationship.