Correlation
Correlation. Bivariate statistics. What is Correlation?. When a researcher want to measure the association between variables Identifying the relationships and summarizing them Involves interval-level variables. Correlation . Designed to answer the following questions:


Correlation
E N D
Presentation Transcript
Correlation Bivariate statistics
What is Correlation? • When a researcher want to measure the association between variables • Identifying the relationships and summarizing them • Involves interval-level variables
Correlation • Designed to answer the following questions: • Is there a relationships between variables? • Bivariate • Multivariate: How do multiple independent variables predict a dependent variable? • How strong is the relationship? • What is the direction of the relationship? • Positive or negative
Correlations should • Make sense • Be based on theory
Which of these correlate? • Hours per week studying and GPA • Quality of relationships with faculty and satisfaction with college • Hours partying per week and GPA
How about these? • Hours in the library and number of presents one receives at Christmas • Number of Facebook friends and number of presents one receives at Christmas
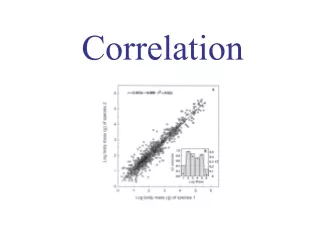
Correlation • To begin to understand a relationship between 2 variables is to examine a scattergram • Scattergramsare graphic displays that permit the researcher to quickly perceive several important features in a relationship. • Page 150 text
Correlation • 2 axes; right angles to each other • Independent variable (x) along the horizontal axis (the abscissa) • Dependent variable (Y) along the vertical axis (the ordinate) • Both axes represent unit measures of each variable • Then, for each case, locate the point along the X axis that corresponds to the score of that case on the Y axis
Correlation • Example • Families with 2 wage earners and how they handle housework • The number of children in the family is related to the amount of time the husband contributes to housekeeping chores
Correlation • Overall pattern of the dots (or observation points) succinctly summarizes the nature of the relationship between 2 variables. • The straight line through the cluster of the dots is called the regression line. • Tells us some impressions about the existence, strength and direction of the relationship
Correlation • Relationship exists: • Y changes as X changes • If not associated, Y would not change • Strength: • Observing the spread of the dots around regression line • Direction: • Observing the angle of the line with respect to the X axis
Correlation • Positive relationship: High scores on X also tend to have high scores on Y • Negative relationship: Opposite high scores on Y associated with low scores on X
Correlation • Analyze statistically the association or correlation between variables • Statistic: correlation coefficient • Pearson’s r • R will always be between -1.00 and +1.00 • If the correlation is negative; we have a negative relationship • If it’s positive, the relationship is positive • Formula
Pearson’s r measures: • strength of the relationship 0 to +/- .30 = weak +/- .31 to +/- 60 = moderate >.60 or <-.60 = strong • direction of the relationship • Positive r means variables increase and decrease together. • Negative r means when one variable increases, the other decreases.
Cautions • Correlation is not causation because • Direction of cause is unclear • An outside variable may cause the relationship
Assumptions • The two variables have a linear relationship • Scores on one variable are normally distributed for each value of the other variable and vice versa • Outliers can have a big effect on the correlation • Text page 149
How to carry out a bivariate correlation • State the research question (What is the association between…? • Test of statistical significance • Strength of association • Effect size
Problem A: Wellness • Research question: • What are the associations between weight, age, exercise and cholesterol?
Output The first table provides descriptive statistics: mean standard deviation and N
Output This table is our primary focus. This is a correlation matrix. This where we determine which variables are correlated including the Pearson correlation coefficient, and the significance level. SPSS flags or asterisks the correlation coefficients that are statistically significant.
Interpretation • To investigate if there were statistically significant associations between weight, sex, age, exercise and cholesterol, correlations were computed. Bivariate analysis shows that 2 of the 10 pairings of variables were significantly correlated. The strongest negative correlation was between exercise and cholesterol r (16)=-.66, p<.05. This means that students who had exercised more were likely to have low cholesterol.
Interpretation (continued) • Weight was also negatively correlated with gender (sex) r(16)=-.80, p<.001. This means that gender of the student was very likely associated with weight.
Interpretation • How can we say the results in plain language?
Text information • Page 149: Concepts used in bivariate correlation • Page 155: Steps for bivariate correlation • (For our purposes: Do not check Spearman’s) • Page 159: How to read SPSS output of correlation matrix • Page 160: How to write interpretation