Download
1 / 24
260 likes | 318 Vues
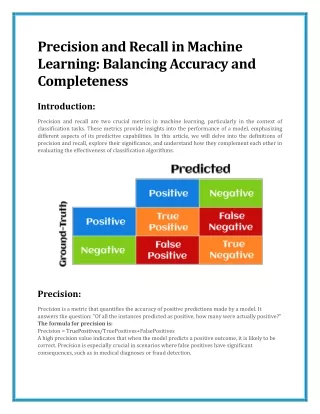
Explore methods to evaluate model performance, including Precision, Recall, and ROC curves. Learn about confusion matrix, precision-recall tradeoff, cost matrix, class imbalance, learning curves, and ROC analysis. Understand how to compare and estimate model performance effectively.

E N D
Precision, Recall and ROC curves CIS4526 Complementary materials
Model Evaluation • Metrics for Performance Evaluation • How to evaluate the performance of a model? • Methods for Performance Evaluation • How to obtain reliable estimates? • Methods for Model Comparison • How to compare the relative performance among competing models?
Model Evaluation • Metrics for Performance Evaluation • How to evaluate the performance of a model? • Methods for Performance Evaluation • How to obtain reliable estimates? • Methods for Model Comparison • How to compare the relative performance among competing models?
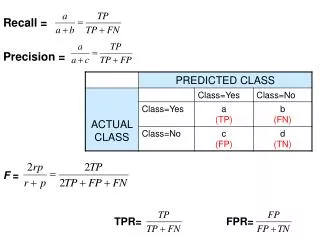
Metrics for Performance Evaluation • Focus on the predictive capability of a model • Rather than how fast it takes to classify or build models, scalability, etc. • Confusion Matrix: a: TP (true positive) b: FN (false negative) c: FP (false positive) d: TN (true negative)
Metrics for Performance Evaluation… • Most widely-used metric:
Limitation of Accuracy • Consider a 2-class problem • Number of Class 0 examples = 9990 • Number of Class 1 examples = 10 • If model predicts everything to be class 0, accuracy is 9990/10000 = 99.9 % • Accuracy is misleading because model does not detect any class 1 example
Cost Matrix C(i|j): Cost of classifying class j example as class i
Computing Cost of Classification Accuracy = 90% Cost = 4255 Accuracy = 80% Cost = 3910
Accuracy is proportional to cost if1. C(Yes|No)=C(No|Yes) = q 2. C(Yes|Yes)=C(No|No) = p N = a + b + c + d Accuracy = (a + d)/N Cost = p (a + d) + q (b + c) = p (a + d) + q (N – a – d) = q N – (q – p)(a + d) = N [q – (q-p) Accuracy] Cost vs Accuracy
Precision-Recall • Precision is biased towards C(Yes|Yes) & C(Yes|No) • Recall is biased towards C(Yes|Yes) & C(No|Yes) • F-measure is biased towards all exceptC(No|No)
Precision-Recall plot • Usually for parameterized models, it controls the precision/recall tradeoff
Model Evaluation • Metrics for Performance Evaluation • How to evaluate the performance of a model? • Methods for Performance Evaluation • How to obtain reliable estimates? • Methods for Model Comparison • How to compare the relative performance among competing models?
Methods for Performance Evaluation • How to obtain a reliable estimate of performance? • Performance of a model may depend on other factors besides the learning algorithm: • Class distribution • Cost of misclassification • Size of training and test sets
Methods of Estimation • Holdout • Reserve 2/3 for training and 1/3 for testing • Random subsampling • One sample may be biased -- Repeated holdout • Cross validation • Partition data into k disjoint subsets • k-fold: train on k-1 partitions, test on the remaining one • Leave-one-out:k=n • Guarantees that each record is used the same number of times for training and testing • Bootstrap • Sampling with replacement • ~63% of records used for training, ~27% for testing
Dealing with class Imbalance • If the class we are interested in is very rare, then the classifier will ignore it. • The class imbalance problem • Solution • We can modify the optimization criterion by using a cost sensitive metric • We can balance the class distribution • Sample from the larger class so that the size of the two classes is the same • Replicate the data of the class of interest so that the classes are balanced • Over-fitting issues
Learning Curve • Learning curve shows how accuracy changes with varying sample size • Requires a sampling schedule for creating learning curve • Effect of small sample size: • Bias in the estimate • Poor model • Underfitting error • Variance of estimate • Poor training data • Overfitting error
Model Evaluation • Metrics for Performance Evaluation • How to evaluate the performance of a model? • Methods for Performance Evaluation • How to obtain reliable estimates? • Methods for Model Comparison • How to compare the relative performance among competing models?
ROC (Receiver Operating Characteristic) • Developed in 1950s for signal detection theory to analyze noisy signals • Characterize the trade-off between positive hits and false alarms • ROC curve plots TPR (on the y-axis) against FPR (on the x-axis) Fraction of positiveinstances predicted as positive Fraction of negative instances predicted as positive
ROC (Receiver Operating Characteristic) • Performance of a classifier represented as a point on the ROC curve • Changing some parameter of the algorithm, sample distribution, or cost matrix changes the location of the point
At thresholdt: TP=0.5, FN=0.5, FP=0.12, FN=0.88 ROC Curve - 1-dimensional data set containing 2 classes (positive and negative) - any points located at x > t is classified as positive
ROC Curve (TP,FP): • (0,0): declare everything to be negative class • (1,1): declare everything to be positive class • (1,0): ideal • Diagonal line: • Random guessing • Below diagonal line: • prediction is opposite of the true class
Using ROC for Model Comparison • No model consistently outperform the other • M1 is better for small FPR • M2 is better for large FPR • Area Under the ROC curve (AUC) • Ideal: Area = 1 • Random guess: • Area = 0.5
ROC curve vs Precision-Recall curve Area Under the Curve (AUC) as a single number for evaluation