Download

1 / 13
130 likes | 459 Vues
A Statistical Analysis of the Precision-Recall Graph. Ralf Herbrich Microsoft Research UK. Joint work with Hugo Zaragoza and Simon Hill. Overview. The Precision-Recall Graph A Stability Analysis Main Result Discussion and Applications Conclusions. Features of Ranking Learning.

E N D
A Statistical Analysis of the Precision-Recall Graph Ralf Herbrich Microsoft Research UK Joint work with Hugo Zaragoza and Simon Hill
Overview • The Precision-Recall Graph • A Stability Analysis • Main Result • Discussion and Applications • Conclusions
Features of Ranking Learning • We cannot take differences of ranks. • We cannot ignore the order of ranks. • Point-wise loss functions do not capture the ranking performance! • ROC or precision-recall curves do capture the ranking performance. • We need generalisation error bounds for ROC and precision-recall curves!
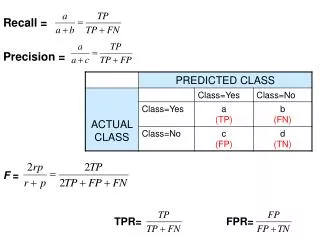
Precision and Recall • Given: • Sample z=((x1,y1),...,(xm,ym)) 2 (X£ {0,1})m with k positive yi together with a function f:X!R. • Ranking the sample: • Re-order the sample: f(x(1)) ¸ ¢¢¢ ¸ f(x(m)) • Record the indices i1,…, ik of the positive y(j). • Precision pi and ri recall:
1 0.9 0.8 0.7 0.6 Precision 0.5 0.4 0.3 0.2 0.1 0 0 0.2 0.4 0.6 0.8 1 Recall The Precision-Recall Graph After reordering: f(x(i))
1 0.9 0.8 0.7 0.6 0.5 Precision 0.4 0.3 0.2 0.1 0 0 0.2 0.4 0.6 0.8 1 Recall Graph Summarisations Break-Even point
A Stability Analysis: Questions • How much does A(f,z) change if we can alter one sample (xi,yi)? • How much does A(f,¢) change if we can alter z? • We will assume that the number of positive examples, k, has to remain constant. • We can only alter xi, i.e. rotate oney(i).
Stability Analysis • Case 1: yi=0 • Case 2: yi=1
Main Result Theorem: For all probability measures, for all ®>1/m, for all f:X!R, with probability at least 1-± over the IID draw of a training and test sample both of size m, if both training sample z and test sample z contain at least d®me positive examples then
Proof • McDiarmid’s inequality: For any function g:Zn!R with stability c, for all probability measures P with probability at least1-± over the IID draw of Z • Set n= 2m and call the two m-halfes Z1 and Z2. Define gi (Z):=A(f,Zi). Then, by IID
Discussions • First bound which shows that asymptotically (m!1) training and test set performance (in terms of average precision) converge! • The effective sample size is only the number of positive examples, in fact, only ®2m . • The proof can be generalised to arbitrary test sample sizes. • The constants can be improved.
Cardinality bounds Compression Bounds (TREC 2002) No VC bounds! No Margin bounds! Union bound: Applications
Conclusions • Ranking learning requires to consider non-point-wise loss functions. • In order to study the complexity of algorithms we need to have large deviation inequalities for ranking performance measures. • McDiarmid’s inequality is a powerful tool. • Future work is focused on ROC curves.