Download

1 / 18
180 likes | 335 Vues
This study presents a detailed statistical analysis of variability in blazars, which are known for their rapid and large fluctuations across various frequencies. Our extensive dataset, amassed since 1992 through the Perugia monitoring program, includes over 20,000 BVRI observations. We explore physical mechanisms underlying this stochastic variability, revealing its chaotic nature rather than deterministic chaos. The results indicate that blazar emissions are characterized by shot or flicker noise, pointing to a system with weakly correlated elements. Our findings aid in identifying faint variable sources amidst background noise.

E N D
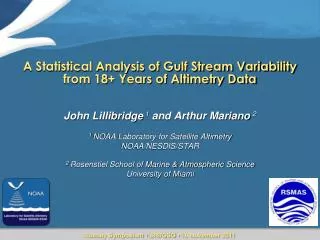
Statistical analysis of variability In a sample of intensively observed blazars Massimo Fiorucci, Gino Tosti Sezione INFN Perugia, Università di Perugia Nicola Marchili Università di Perugia
Statistical analysis of variability • Blazars are characterised by rapid and large variability at all frequencies • In the last years, many efforts have been spent to understand the physical mechanisms responsible for the variable emission • However, blazars emit signals that appear to vary chaotically with time.
This behaviour is expected in two qualitatively different situations: • In a system consisting of a large number of weakly correlated elements which appear at random and live only a short time. • The global evolution of a system described by non-linear differential equations which shows deterministic chaos.
Optical and gamma-ray variability seem to be strongly correlated
Optical variability: chaotic behaviour or correlated signal? • The Perugia monitoring program started in 1992. • We have collected more than 20000 BVRI observations and our sample forms one of the larger set of optical data available. • We are cooperating with other international teems to improve the sampling for many blazars. • We can use this large database to study variability with statistical techniques.
Optical variability: chaotic behaviour or correlated signal? • Preliminary results show that the observed variability is truly stochastic and is not caused by deterministic chaos • Blazar variability seems to be characterised by shot or flicker noise • The system probably consist of a large number of weakly correlated elements which appear at random, live only a short time and decay
and GLAST ? • The simulation of variability can be extended towards high energy with the theoretical models. • Our statistical analysis can be used to discriminate faint variable sources against the background noise