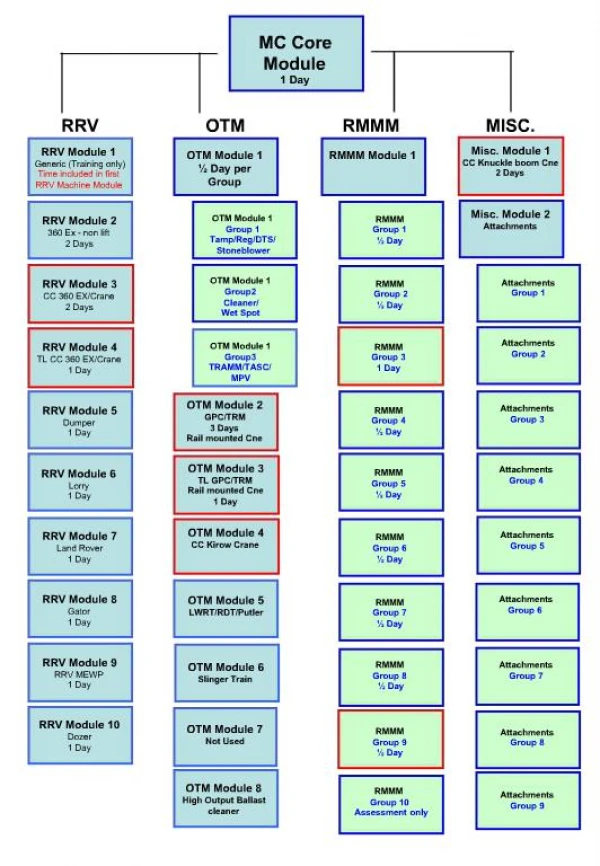
Module 2:
Module 2:. Nonlinear Regression. Outline -. Single response Notation Assumptions Least Squares Estimation – Gauss-Newton Iteration, convergence criteria, numerical optimization Diagnostics Properties of Estimators and Inference

Module 2:
E N D
Presentation Transcript
Module 2: Nonlinear Regression
Outline - Single response • Notation • Assumptions • Least Squares Estimation – Gauss-Newton Iteration, convergence criteria, numerical optimization • Diagnostics • Properties of Estimators and Inference • Other estimation formulations – maximum likelihood and Bayesian estimators • Dealing with differential equation models • And then on to multi-response… J. McLellan
Notation random noise component Model: Model specification – • the model equation is • with n experimental runs, we have • defines the expectation surface • the nonlinear regression model is • Model specification involves form of equationand parameterization explanatory variables – ith run conditions p-dimensional vector of parameters J. McLellan
Example #1 (Bates and Watts, 1988) Rumford data – • Cooling experiment – grind cannon barrel with blunt bore, and then monitor temperature while it cools • Newton’s law of cooling – differential equation with exponential solution • Independent variable is t (time) • Ambient T was 60 F • Model equation • 1st-order dynamic decay J. McLellan
Rumford Example • Consider two observations – 2-dimensional observation space • At t=4, t=41 min J. McLellan
Parameter Estimation – Linear Regression Case approximating observation vector residual vector observations Expectation surface J. McLellan
Parameter Estimation - Nonlinear Regression Case approximating observation vector residual vector observations expectation surface J. McLellan
Parameter Estimation – Gauss-Newton Iteration Least squares estimation – minimize Iterative procedure consisting of: • Linearization about the current estimate of the parameters • Solution of the linear(ized) regression problem to obtain the next parameter estimate • Iteration until a convergence criterion is satisfied J. McLellan
Linearization about a nominal parameter vector Linearize the expectation function η(θ) in terms of the parameter vectorθ about a nominal vector θ0: • Sensitivity Matrix • Jacobian of the expectationfunction • contains first-order sensitivity information J. McLellan
Parameter Estimation – Gauss-Newton Iteration Iterative procedure consisting of: • Linearization about the current estimate of the parameters • Solution of the linear(ized) regression problem to obtain the next parameter estimate update • Iteration until a convergence criterion is satisfied • for example, J. McLellan
Parameter Estimation - Nonlinear Regression Case approximating observation vector observations Tangent plane approximation J. McLellan
Quality of the Linear Approximation … depends on two components: • Degree to which the tangent plane provides a good approximation to the expectation surface- the planar assumption- related to intrinsic nonlinearity • Uniformity of the coordinates on the expectation surface – uniform coordinates- the linearization implies a uniform coordinate system on the tangent plane approximation – equal changes in a given parameter produce equal sized increments on the tangent plane- equal-sized increments in a given parameter may map to unequal-sized increments on the expectation surface J. McLellan
Rumford Example • Consider two observations – 2-dimensional observation space • At t=4, t=41 min θ = 0 θ changed in increments of 0.025 Non-uniformity in coordinates Tangent plane approximation θ = 10 J. McLellan
Rumford example • Model function • Dataset consists of 13 observations • Exercise – sensitivity matrix? • Dimensions? J. McLellan
Rumford example – tangent approximation • At θ = 0.05, Note uniformity in coordinateson tangent plane Non-uniformity in coordinates Tangent plane approximation J. McLellan
Rumford example – tangent approximation • At θ = 0.7, J. McLellan
Parameter Estimation – Gauss-Newton Iteration Parameter estimation after jth iteration: Convergence • can be declared by looking at: • relative progress in the parameter estimate • relative progress in reducing the sum of squares function • combination of both progress in sum of squares reduction and progress in parameter estimates J. McLellan
Parameter Estimation – Gauss-Newton Iteration Convergence • the relative change criteria in sum of squares or parameter estimates terminate on lack of progress, rather than convergence (Bates and Watts, 1988) • alternative – due to Bates and Watts, termed the relative offset criterion • we will have converged to the true optimum (least squares estimates) if the residual vector is orthogonal to the nonlinear expectation surface, and in particular, its tangent plane approximation at the true parameter values • if we haven’t converged, the residual vectorwon’t necessarily be orthogonal to the tangent plane at the current parameter iterate J. McLellan
Parameter Estimation – Gauss-Newton Iteration Convergence • declare convergence by comparing component of residual vector lying on tangent plane to the component orthogonal to the tangent plane – if the component on the tangent plane is small, then we are close to orthogonality convergence • Note also that after each iteration, the residual vector is orthogonal to the tangent plane computed at the previous parameter iterate (where the linearization is conducted), and not necessarily to the tangent plane and expectation surface at the most recently computed parameter estimate J. McLellan
Computational Issues in Gauss-Newton Iteration The Gauss-Newton iteration can be subject to poor numerical conditioning, as the linearization is recomputed at new parameter iterates • Conditioning problems arise in inversion of VTV • Solution – use a decomposition technique • QR decomposition • Singular Value Decomposition (SVD) • Decomposition techniques will accommodate changes in rank of the Jacobian (sensitivity) matrix V J. McLellan
QR Decomposition An n x p matrix V takes vectors from a p-dimensional space into an n-dimensional space N V M n-dimensional e.g., n=3 p-dimensional e.g., p=2 J. McLellan
QR Decomposition • The columns of the matrix V (viewed as a linear mapping) are the images of the basis vectors for the domain space (M) expressed in the basis of the range space (N) • If M is a p-dimensional space, and N is an n-dimensional space (with p<n), then V defines a p-dimensional linear subspace in N as long as V is of full rank • Think of our expectation plane in the observation space for the linear regression case – the observation space is n-dimensional, while the expectation plane is p-dimensional where p is the number of parameters • We can find a new basis for the range space (N) so that the first p basis vectors span the range of the mapping V, and the remaining n-p basis vectors are orthogonal to the range space of V J. McLellan
QR Decomposition • In the new range space basis, the mapping will have zero elements in the last n-p elements of the mapping vector since the last n-p basis vectors are orthogonal to the range of V • By construction, we can express V as an upper-triangular matrix • This is a QR decomposition J. McLellan
QR Decomposition • Example – linear regression with y3 β2 X y2 β1 y1 Perform QR decomposition J. McLellan
QR Decomposition • In the new basis, the expectation plane becomes z3 β2 z2 β1 z1 J. McLellan
QR Decomposition • The new basis for the range space is given by the columns of Q Visualize the new basis vectorsfor the observation space relativeto the original basis y3 q2 q3 z1 is distance along q1, z2 is distance along q2, z3 is distance along q3 y2 q1 y1 J. McLellan
QR Decomposition • In the new coordinates, z3 z1 is distance along q1, z2 is distance along q2, z3 is distance along q3 z2 z1 J. McLellan
QR Decomposition There are various ways to compute a QR decomposition • Gram-Schmidt orthogonalization – sequential orthogonalization • Householder transformations – sequence of reflections J. McLellan
QR Decompositions and Parameter Estimation How does QR decomposition aid parameter estimation? • QR decomposition will identify the effective rank of the estimation problem through the process of computing the decomposition • # of vectors spanning range space of V is the effective dimension of the estimation problem • If dimension changes with successive linearizations, QR decomposition will track this change • Reformulating the estimation problem using a QR decomposition improves the numerical conditioning and ease of solution for the problem • Over-constrained problem: e.g., for the linear regression case, find β to come as close to satisfying J. McLellan
QR Decompositions and Parameter Estimation • R1 is upper-triangular, and so the parameter estimates can be obtained sequentially • The Gauss-Newton iteration follows the same pattern • Perform QR decompositions on each V • QR decomposition also plays an important role in understanding nonlinearity • Look at second-derivative vectors and partition them into components lying in the tangent plane (associated with tangential curvature) and those lying orthogonal to the tangent plane (associated with intrinsic curvature) • QR decomposition can be used to construct this partitioning • First p vectors span the tangent plane, remaining are orthogonal to it J. McLellan
Singular Value Decomposition • Singular value decompositions (SVDs) are similar to eigenvector decompositions for matrices • SVD: Where • U is the “output rotation matrix” • V is the “input rotation matrix” (pls don’t confuse with Jacobian!) • Σ is a diagonal matrix of singular values J. McLellan
Singular Value Decomposition • Singular values: i.e., the positive square root of the eigenvalues of XTX, which is square (will be pxp, where p is the number of parameters) • Input singular vectors form the columns of V, and are the eigenvectors of XTX • Output singular vectors form the columns of U, and are the eigenvectors of X XT • One perspective – find new bases for the input space (parameter space) and output space (observation space) in which X becomes a diagonal matrix – only performs scaling, no rotation • For parameter estimation problems, U will be nxn, and V will be pxp; Σ will be nxp J. McLellan
SVD and Parameter Estimation • SVD will accommodate effective rank of the estimation problem, and can track changes in the rank of the problem • Recent work tries to alter the dimension of the problem using SVD information • SVD can improve the numerical conditioning and ease of solution of the problem J. McLellan
Other numerical estimation methods • Focus on minimizing the sum of squares function using optimization techniques • Newton-Raphson solution • Solve for increments using second-order approximation of sum of squares function • Levenberg-Marquardt compromise • Modification of the Gauss-Newton iteration, with introduction of factor to improve conditioning of linear regression step • Nelder-Mead • Pattern search method – doesn’t use derivative information • Hybrid approaches • Use combination of derivative-free and derivative-based methods J. McLellan
Other numerical estimation methods • In general, the least squares parameter estimation approach represents a minimization problem • Use optimization technique to find parameter estimates to minimize the sum of squares of the residuals J. McLellan
Newton-Raphson approach • Start with the residual sum of squares function S(θ) and form the 2nd-order Taylor series expansion:where H is the Hessian of S(θ): • the Hessian is the multivariable second-derivative for a function of a vector • Now solve for the next move by applying the stationarity condition (take 1st derivative, set to zero) J. McLellan
Hessian • Is the matrix of second derivatives – (consider using Maple to generate!) J. McLellan
Jacobian and Hessian of S(θ) • Can be found by the chain rule: the sensitivity matrix that we had before: V Often used as anapproximation of the Hessian – “expectedvalue of the Hessian” 3-dimensional array(tensor) J. McLellan
Newton-Raphson approach • Using the approximate Hessian (which is always positive semi-definite), the change in parameter estimate is:where V is evaluated at θ(i) is the sensitivity matrix. • This is the Gauss-Newton iteration! • Issues – computing and updating the Hessian matrix • Potential better progress – information about curvature • Hessian can cease to be positive definite (required in order for stationary point to be a minimum) J. McLellan
Levenberg-Marquardt approach • Improve the conditioning of the inverse by adding a factor – biased regression solution – • Levenberg modificationwhere Ip is the pxp identity matrix • Marquardt modificationwhere D is a matrix containing the diagonal entries of VTV • If λ -> 0, approach Gauss-Newton iteration • If λ -> ∞, approach direction of steepest ascent – optimization technique J. McLellan
Inference – Joint Confidence Regions • Approximate confidence regions for parameters and predictions can be obtained by using a linearization approach • Approximate covariance matrix for parameter estimates:where denotes the Jacobian of the expectation mapping evaluated at the least squares parameter estimates • This covariance matrix is asymptotically the true covariance matrix for the parameter estimates as the number of data points becomes infinite • 100(1-α)% joint confidence region for the parameters: • compare to the linear regression case J. McLellan
Inference – Marginal Confidence Intervals • Marginal confidence intervals • Confidence intervals on individual parameterswhere is the approximate standard error of the parameter estimate – i-th diagonal element of the approximate parameter estimate covariance matrix, with noise variance estimated as in the linear case J. McLellan
Inference – Predictions & Confidence Intervals • Confidence intervals on predictions of existing points in the dataset • Reflect propagation of variability from the parameter estimates to the predictions • Expressions for nonlinear regression case based on linear approximation and direct extension of results for linear regression First, let’s review the linear regression case… J. McLellan
Precision of the Predicted Responses - Linear From the linear regression module (module 1) – The predicted response from an estimated model has uncertainty, because it is a function of the parameter estimates which have uncertainty: e.g., Solder Wave Defect Model - first response at the point -1,-1,-1 If the parameter estimates were uncorrelated, the variance of the predicted response would be: (recall results for variance of sum of random variables) J. McLellan
Precision of the Predicted Responses - Linear In general, both the variances and covariances of the parameter estimates must be taken into account. For prediction at the k-th data point: Note - J. McLellan
Precision of the Predicted Responses - Nonlinear Linearize the prediction equation about the least squares estimate: For prediction at the k-th data point: Note - J. McLellan
Estimating Precision of Predicted Responses Use an estimate of the inherent noise variance The degrees of freedom for the estimated variance of the predicted response are those of the estimate of the noise variance • replicates • external estimate • MSE linear nonlinear J. McLellan
Confidence Limits for Predicted Responses Linear and Nonlinear Cases: Follow an approach similar to that for parameters - 100(1-α)% confidence limits for predicted response at the k-th run are: • degrees of freedom are those of the inherent noise variance estimate If the prediction is for a response at conditions OTHER than one of the experimental runs, the limits are: J. McLellan
Precision of “Future” Predictions - Explanation Suppose we want to predict the response at conditions other than those of the experimental runs --> future run. The value we observe will consist of the component from the deterministic component, plus the noise component. In predicting this value, we must consider: • uncertainty from our prediction of the deterministic component • noise component The variance of this future prediction is where is computed using the same expression for variance of predicted responses at experimental run conditions - For linear case, with x containing specific run conditions, J. McLellan
Properties of LS Parameter Estimates Key Point - parameter estimates are random variables • because of how stochastic variation in data propagates through estimation calculations • parameter estimates have a variability pattern - probability distribution and density functions Unbiased • “average” of repeated data collection / estimation sequences will be true value of parameter vector J. McLellan