Working Capital Policy
Working Capital Policy. Chapter 17. Learning Objectives. Understand the importance of working capital. The liquidity-profitability trade-off. Determining the optimal level of current assets. The risk and return implications of alternative approaches to working capital financing policy.


Working Capital Policy
E N D
Presentation Transcript
Working Capital Policy Chapter 17
Learning Objectives • Understand the importance of working capital. • The liquidity-profitability trade-off. • Determining the optimal level of current assets. • The risk and return implications of alternative approaches to working capital financing policy.
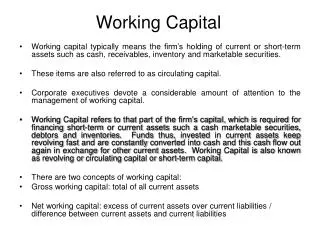
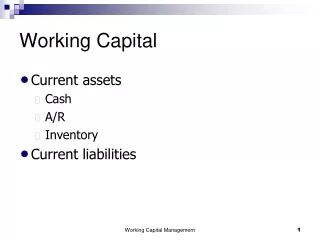
The Importance of Managing and Accumulating Working Capital • Working capital is the amount of the firm’s current assets: cash, accounts receivable, marketable securities, inventory and prepaid expenses. • Managing the level and financing of working capital is necessary: • to keep costs under control (e.g. storage of inventory) • to keep risk levels at an appropriate level (e.g. liquidity)
Managing Current Assets & Liabilities • Net Working Capital = Current Assets - Current Liabilities • Determining the “Correct” level of Working Capital • Balance Risk & Return • Benefits of Working Capital • Higher Liquidity (Lowers Risk) • Costs of Working Capital • Lower Returns - $$ invested in lower returning securities rather than production.
Firm 1 ST Debt 100 LT Debt 400 Common Stock 500 Total Liabilities&Equity 1000 Firm 1 Marketable Securities 0 Other Current Assets 200 Fixed Assets 800 Total Assets 1000 Firm 1 Operating Earnings 150 Interest Earned 0 EBT 150 Taxes (40%) -60 Net Income 90 Current Assets Current Liabilities Current Ratio = 200 100 = Example: Risk-Return Trade-off Compare the 2 following companies = 2 Current Ratio 2
Firm 1 ST Debt 100 LT Debt 400 Common Stock 500 Total Liabilities&Equity 1000 Firm 1 Marketable Securities 0 Other Current Assets 200 Fixed Assets 800 Total Assets 1000 Firm 1 Operating Earnings 150 Interest Earned 0 EBT 150 Taxes (40%) -60 Net Income 90 Current Ratio 2 Net Income Assets Return on Assets = 90 1000 = .09 = 9% = Example: Risk-Return Trade-off Compare the 2 following companies ROA 9%
Firm 1Firm 2 Marketable Securities 0 200 Other Current Assets 200 200 Fixed Assets 800 800 Total Assets 1000 1200 Firm 1Firm 2 ST Debt 100 100 LT Debt 400 400 Common Stock 500 700 Total Liabilities&Equity 1000 1200 Firm 1Firm 2 Operating Earnings 150 150 Interest Earned 0 8 EBT 150 158 Taxes (40%) -60 -63 Net Income 90 95 Current Ratio 2 ROA 9% Example: Risk-Return Trade-off Compare the 2 following companies Firm 2: $200 Marketable Securities Financed with Common Stock 200 x 4% = $8 interest earned
Firm 1Firm 2 Marketable Securities 0 200 Other Current Assets 200 200 Fixed Assets 800 800 Total Assets 1000 1200 Firm 1Firm 2 ST Debt 100 100 LT Debt 400 400 Common Stock 500 700 Total Liabilities&Equity 1000 1200 Firm 1Firm 2 Operating Earnings 150 150 Interest Earned 0 8 EBT 150 158 Taxes (40%) -60 -63 Net Income 90 95 Current Ratio 2 ROA 9% CA CL Current Ratio = 400 100 = 4 Example: Risk-Return Trade-off Compare the 2 following companies = 4
Firm 1Firm 2 Marketable Securities 0 200 Other Current Assets 200 200 Fixed Assets 800 800 Total Assets 1000 1200 Firm 1Firm 2 ST Debt 100 100 LT Debt 400 400 Common Stock 500 700 Total Liabilities&Equity 1000 1200 Firm 1Firm 2 Operating Earnings 150 150 Interest Earned 0 8 EBT 150 158 Taxes (40%) -60 -63 Net Income 90 95 Current Ratio 2 4 ROA 9% NI Assets Return on Assets = 95 1200 = 7.9% Example: Risk-Return Trade-off Compare the 2 following companies =.079 = 7.9%
Firm 1Firm 2 Marketable Securities 0 200 Other Current Assets 200 200 Fixed Assets 800 800 Total Assets 1000 1200 Firm 1Firm 2 ST Debt 100 100 LT Debt 400 400 Common Stock 500 700 Total Liabilities&Equity 1000 1200 Firm 1Firm 2 Operating Earnings 150 150 Interest Earned 0 8 EBT 150 158 Taxes (40%) -60 -63 Net Income 90 95 Current Ratio 2 4 ROA 9% 7.9% Example: Risk-Return Trade-off Compare the 2 following companies Firm 2 Lower ROA More Liquid Less Risky Firm 1 Higher ROA Less Liquid Riskier
Variation in assets over time Total Assets } $5M Fixed Assets Time Assume ZERO Long-term Growth
Variation in assets over time Total Assets $7M } Permanent Current Assets } $5M Fixed Assets Time
Total Assets $7M } Permanent Current Assets } $5M Fixed Assets Time Variation in assets over time $10M Temporary Current Assets
Different Approaches to Financing • Conservative Approach • Finance all fixed assets, permanent current assets, and some temporary with LT debt or equity. ST financing is used for the remaining temp. current assets. • Lower risk, lower return
Total Assets Total Assets $10M $10M Temporary Current Assets Temporary Current Assets $7M $7M } } Permanent Current Assets Permanent Current Assets } } Long-term Sources $5M $5M Fixed Assets Fixed Assets Time Time Financing Current Assets: Conservative Approach Short-term Sources
Different Approaches to Financing • Conservative Approach • Finance all fixed assets, permanent current assets, and some temporary with LT debt or equity. ST financing is used for the remaining temp. current assets. • Lower risk, lower return • Moderate Approach (Maturity Matching) • Finance fixed assets and permanent current assets with LT funds and temporary current assets with ST funds. • Moderate risk, moderate return
Total Assets Total Assets $10M Temporary Current Assets $7M $7M } } Permanent Current Assets Permanent Current Assets } } $5M $5M Long-term Sources Fixed Assets Fixed Assets Time Time Financing Current Assets: Moderate Approach $10M Temporary Current Assets
Total Assets Total Assets $10M $10M Temporary Current Assets Temporary Current Assets $7M $7M } } Permanent Current Assets Permanent Current Assets } } $5M $5M Long-term Sources Fixed Assets Fixed Assets Time Time Financing Current Assets: Moderate Approach Short-term Sources
Different Approaches to Financing • Conservative Approach • Finance all fixed assets, permanent current assets, and some temporary with LT debt or equity. ST financing is used for the remaining temp. current assets. • Lower risk, lower return • Moderate Approach (Maturity Matching) • Finance fixed assets and permanent current assets with LT funds and temporary current assets with ST funds. • Moderate risk, moderate return • Aggressive Approach • Finance all temporary current assets, permanent current assets, and some fixed assets with ST debt. LT financing is used for the remaining fixed assets. • Higher risk, higher return
Total Assets Total Assets Short-term Sources $10M $10M Temporary Current Assets Temporary Current Assets $7M $7M } } Permanent Current Assets Permanent Current Assets } } $5M $5M Fixed Assets Fixed Assets Time Time Financing Current Assets: Aggressive Approach Long-term Sources
Managing (WARM, SOFT) Cash Chapter 18
How much cash should a firm keep on hand? • Managers must keep enough cash to make payments when needed. (Minimum balance) • But since cash is a non-earning asset, managers should invest excess returns and keep just the amount of cash that is necessary.(Maximum balance)
The size of the minimum cash balance depends on: • How quickly and cheaply a firm can raise cash when needed. • How accurately managers can predict cash requirements. • How much precautionary cash the managers need for emergencies. Link to Dun & Bradstreet
The firm’s maximum cash balance depends on: • Available (short-term) investment opportunities • e.g. money market funds, CDs, commercial paper • Expected return on investment opportunities (opportunity cost) • If high expected return, firms are quick to invest excess cash • Transaction cost of withdrawing cash and making an investment Link to Bureau of Economic Analysis
Choosing the Optimum Cash Balance Cash Balances in a Typical Month Dollars in the Cash Account | | | | | | | | | | | | | | | | | | | | | | | | | | | | Days of the Month
Cash Balances in a Typical Month Invest Excess Cash Dollars in the Cash Account | | | | | | | | | | | | | | | | | | | | | | | | | | | | Days of the Month Choosing the Optimum Cash Balance
Cash Balances in a Typical Month Sell Securities to obtain cash Dollars in the Cash Account | | | | | | | | | | | | | | | | | | | | | | | | | | | | Days of the Month Choosing the Optimum Cash Balance
The Miller - Orr Model • The Miller-Orr Model provides a formula for determining the optimum cash balance, the point at which to sell securities (lower limit) and when to invest excess cash (upper limit). • Depends on: • transaction costs of buying or selling securities • variability of daily cash • return on short-term investments
3 3 x TC x V 4 x r Z = + L The Miller-Orr Model - Target Cash Balance (Z) where: TC = transaction cost of buying or selling securities V = variance of daily cash flows r = return on short-term investments L = minimum cash requirement
The Miller-Orr Model - Target Cash Balance (Z) Example:Suppose that short-term securities yield 5% per year (r) and it costs the firm $50 each time it buys or sells securities (TC). The variance of cash flows is $100,000 (V) and your bank requires $1,000 minimum checking account balance (L).
3 3 x 50 x 100,000 4 x .05/365 Z = + $1,000 = $3,014 + $1,000 = $4,014 The Miller-Orr Model - Target Cash Balance (Z) • Example
The Miller-Orr Mode - Upper Limit • The upper limit for the cash account (H) is determined by the equation: H = 3Z - 2L where: Z = Target cash balance L = Lower limit • In the previous example: H = 3 ($4,014) - 2($1,000) = $10,042
Forecasting Cash Needs - Cash Budget • Used to determine monthly needs and surpluses for cash during the planning period • Examines timing of cash inflows and outflows i.e. when checks are written and when deposits are made. • Payments to suppliers are typically made some time after shipment is received. • Receipts from credit customers are received some time after sale is recorded.
Cash Budget - Problem Rocky Mountain Climbing, Inc. (RMC) has the following information: Previous Sales November 2007 130,000 December 2007 125,000 Forecast Sales January 2008 120,000 February 2008 260,000 March 2008 140,000 April 2008 140,000
Cash Budget - Problem Rocky Mountain Climbing, Inc. (RMC) has the following information: Previous Sales: November 2007 130,000 December 2007 125,000 Forecast sales for: January 2008 120,000 February 2008 260,000 March 2008 140,000 April 2008 140,000 Collections : 30% of customers pay cash 50% pay in month after sale 20% pay 2 months after sale
Cash Budget - Problem Other information for RMC Cash Budget: Purchases of inventory are 75% of sales and are made 2 months before sale and are paid for 1 month after delivery Other expenses $14,000 per month Taxes $10,000 due in March Cash Balance (Dec. 31, 2007) = $28,000 Minimum balance required by bank = $25,000 (ST borrowing rate = 6% annually)
Steps in the Cash Budget • Forecast of monthly collections and other cash inflows • Forecast of purchases and other cash outflows • Summarize the effect on net monthly cash flows and determine borrowing needs or surpluses.
Cash Budget - Collections • In each month RMC will collect cash from sales that have occurred in that month and in the preceding two months. • In January, sales are 120,000 • Collections: • 30% x $120,000 (January sales) = 36,000 • 50% x $125,000 (December sales) = 62,500 • 20% x $130,000 (November sales) = 26,000 • Total cash collected in January =$124,500
Collection of January Sales Nov Dec Jan Feb Mar Sales 130,000 125,000 120,000 260,000 140,000 Cash Budget - Collections Sales made in January will not be fully collected until March. 36,000 120,000 x .30
Collection of January Sales Nov Dec Jan Feb Mar Sales 130,000 125,000 120,000 260,000 140,000 36,000 120,000 x .30 Cash Budget - Collections Sales made in January will not be fully collected until March. 60,000 120,000 x .50
Collection of January Sales Nov Dec Jan Feb Mar Sales 130,000 125,000 120,000 260,000 140,000 60,000 36,000 120,000 x .30 120,000 x .50 Cash Budget - Collections Sales made in January will not be fully collected until March. 24,000 120,000 x .20
Cash Budget RMC, Inc. Nov Dec Jan Feb Mar Sales 130,000 125,000 120,000 260,000 140,000 Collections: Month of Sale (30%) 36,000 78,000 42,000 First Month (50%) 62,500 60,000 130,000 2nd Month (20%) 26,000 25,000 24,000 Total Collections 124,500 163,000 196,000 Cash Budget - Collections Calculate collections for other months.
Payments for January Purchases Nov Dec Jan Feb Mar Sales 130,000 125,000 120,000 260,000 140,000 Cash Budget - Purchases/Payments Purchases are made 2 months prior to sale and are paid for 1 month later. 90,000 75% of January Sales Purchased in November
Payments for January Purchases Nov Dec Jan Feb Mar Sales 130,000 125,000 120,000 260,000 140,000 Cash Budget - Purchases/Payments Purchases are made 2 months prior to sale and are paid for 1 month later. 90,000 90,000 75% of January Sales Purchased in November, Paid for in December
Cash Budget RMC, Inc. Nov Dec Jan Feb Mar Apr Sales 130,000 125,000 120,000 260,000 140,000 140,000 Purchases 195,000 105,000 105,000 Payments 195,000 105,000 105,000 Cash Budget - Purchases/Payments Calculate payments for all months. Note that in order to do a cash budget, you will need forecasts of sales for April.
Cash Budget RMC, Inc. Jan Feb Mar Cash Collections 124,500 163,000 196,000 Material Payments 195,000 105,000 105,000 Summary of Previous Calculations
Cash Budget RMC, Inc. Jan Feb Mar Cash Collections 124,500 163,000 196,000 Material Payments 195,000 105,000 105,000 Other Payments: Other Expenses 14,000 14,000 14,000 Tax Payments 0 0 10,000 Remaining Cash Outflows
Cash Budget RMC, Inc. Jan Feb Mar Cash Collections 124,500 163,000 196,000 Material Payments 195,000 105,000 105,000 Other Payments: Rent 2,000 2,000 2,000 Other Expenses 12,000 12,000 12,000 Tax Payments 0 0 10,000 Net Monthly Change (84,500) 44,000 67,000
Cash Budget RMC, Inc. Jan Feb Mar Analysis of Borrowing Needs Net Monthly Change (84,500) 44,000 67,000 Beginning Cash Balance 28,000 Ending Cash (No Borrow) Needed (Borrowing) Loan Repayment Interest Cost Ending Cash Balance Cumulative Borrowing
Cash Budget RMC, Inc. Jan Feb Mar Analysis of Borrowing Needs Net Monthly Change (84,500) 44,000 67,000 Beginning Cash Balance 28,000 Ending Cash (No Borrow) (56,500) Needed (Borrowing) Loan Repayment Interest Cost Ending Cash Balance Cumulative Borrowing