Download
1 / 5
60 likes | 244 Vues
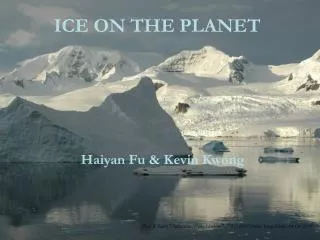
ICE ON THE PLANET. Haiyan Fu & Kevin Kwong. Rita Willaert ."Antarctica - Neko Harbour".27 Feb 2007.Online Image.Flickr . 04 Oct 2011. Estimate of the size of the cryosphere ( Fitzharis 1996). Image Courtesy of the CIA World Factbook. Melting Ice Sheets and Sea Level Rise.

E N D
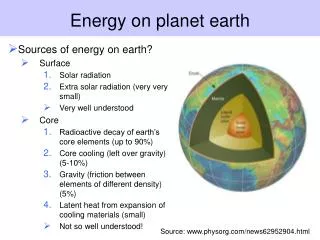
ICE ON THE PLANET Haiyan Fu & Kevin Kwong Rita Willaert."Antarctica - Neko Harbour".27 Feb 2007.Online Image.Flickr. 04 Oct 2011.
Estimate of the size of the cryosphere(Fitzharis 1996) Image Courtesy of the CIA World Factbook Melting Ice Sheets and Sea Level Rise
Components of the cryosphere and their time scales (Peter Lemke et al. 2007)
Mass Balance Analyses of Ice Sheets Greenland, showing rates of surface-elevation change between the late 1990s and 2003, derived by comparing satellite and aircraft laser-altimeter surveys Antarctica, showing rates of surface-elevation change derived from satellite radar-altimeter measurements Bentley et al. 2007
Models for Ice Sheet–Climate Interactions Under Anthropogenic Greenhouse Forcings Scenarios for atmospheric concentration of CO2 increasing by 1% per year, until 2x, 3x and 4x pre-industrial levels are achieved Two-dimensional pattern of changes of sea level (m) due to ocean thermal expansion and changes in the volume of ice sheets for the simulations a 2 x, b 3x, and c 4x Net sea level rise is largest in 3 x (+1.1 m) compared to 4 x (+.6 m) and 2 x (+.2 m) Vizcaino et al. 2008