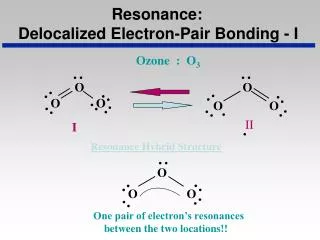
Download
1 / 17
180 likes | 302 Vues
Explore EPR for radicals, oxidation, biradicals, kinetics, polymers in Chemistry & Medicine, materials & elements in Physics. Study EPR principles, spectrometer setup, and spectrum analysis. Utilize EPR for protein labeling, metallo-enzymes, and food safety control. Discover EPR's role in materials research, magnetic resonance, and biological systems. Unlock insights through EPR and ENDOR techniques at high frequencies for enhanced sensitivity and resolution.

E N D
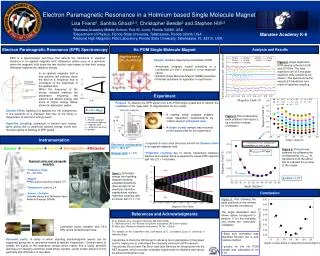
Electron Paramagnetic Resonance (EPR) at X- and W-band Frequencies at the University of Alabama
EPR provides detection and study of radicals (R), systems containing unpaired electron spins Oxidation and reduction processes Biradicals and triplet state molecules Reaction kinetics Structure, dynamics, and reactions of polymers Chemistry Free radicals in living tissue Radical-initiated carcinogenesis Oxygen concentration measurement Spin trapping of short-lived radicals Polymers Fullerenes Glasses Corrosion Material research Medicine R • Magnetic susceptibility • Semiconductors • Defects in crystals • Quantum dots • High T superconductors Photosynthesis Protein labeling Enzymatic reactions Metallo-enzymes Control of irradiated food Biology Physics
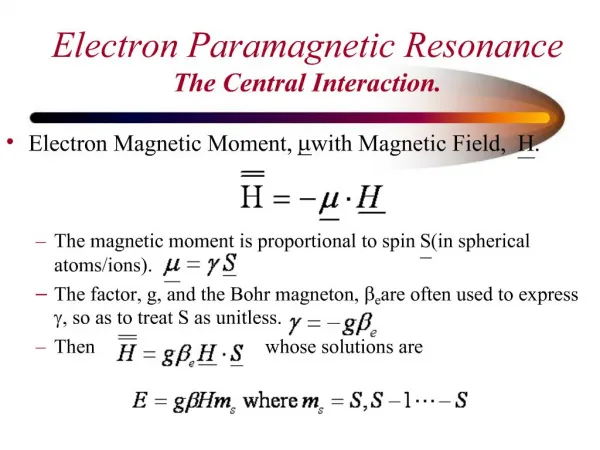
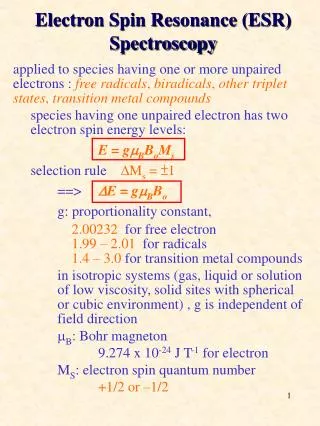
Magnetic Resonance Condition B0 • The electron has a magnetic moment: • e = gS • g factor = 2.0023 for free electron • - Bohr magneton S = ½ - electron spin N S S N ms = - ½ ms = + ½ ms = ½ - projection of the electron spin (S) on the direction of the magnetic field In magnetic field, B0 E = - e B0 = g B0ms = ½g B0 +1/2 gB0 E A peak in the absorption occurs when the energy difference between two levels (gB0) matches the energy of irradiation (h) h = gB0 -1/2 gB0 B = 0 B > 0
h = gBr In EPR experiment we keep the radiation frequency constant and scan the magnetic field • Frequency EPR 103 > NMR (GHz vs MHz) • Coupling EPR 106 > NMR (MHz vs Hz) • Relaxation EPR 106 < NMR (ns vs ms) • Sensitivity EPR 106 > NMR
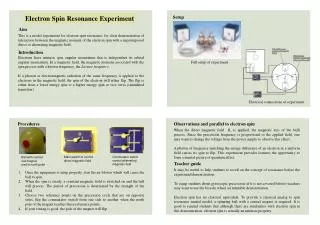
The general outlay of an EPR spectrometer MW Bridge Field controller Signal channel Cavity Console Magnet Signal Processing & Control Electronics
Frequency band MW Frequency Magnetic Field Sample tube o.d. GHz mT mm X 9.2 330 4 Q 35 1200 2 W 94 3300 0.9 Available at the University of Alabama
What kind of information can we extract from EPR spectrum? giso The integrated intensity of the EPR signal - Concentration g – Value – a “fingerprint” of the radical; electronic structure and symmetry Spheric gX gY gII g I gZ Rhombic Cylindrical
Multiplet Structure • Hyperfine interactions (HFI) • Zero-field interactions • Dipole-dipole interactions HFI splits EPR line into (2nI + 1) lines, were I is a nuclear spin, n – number of equivalent nuclei aN aH Quinone: 4 protons (IH = ½) Nitroxide: 1N (IN = 1)
ENDOR (Electron Nuclear Double Resonance) provides missing information • A) For many biological systems with small hfc constants which are not resolved in EPR spectrum: ENDOR P700 radical cation (Chl a dimer) EPR
B) If number of EPR lines are too large to make an analysis For an electron spin S = ½ coupled to N nuclear spins I = ½, EPR spectrum consists of 2N lines, whereas ENDOR spectrum exhibits only 2N lines. MS = 1 MI = 0 MS = 0 MI = 1 ENDOR EPR
Phenalenyl radical NMR = n a/2 EPR ENDOR A1 A2 Hyperfine enhancement effect
Why use higher frequencies?95 GHz and > • To increase sensitivity • To improve g-tensor resolution 9 GHz 95 GHz gYY TEMPONE gXX gZZ gII MYOGLOBIN gI
hg By increasing frequency , we can make H greater than the linewidth. H = g(g + g) • To separate radicals with close g values: To improve resolution for high spin systems with large ZFS 109 GHz h>ZFS 9 GHz ZFS>h Fe3+(S = 5/2) To measure relaxation times (higher frequencies are often more sensitive to fast molecular motions than lower frequencies
Why use pulse EPR? • Structure and location of catalytically active species on high-surface area solids and within molecular sieves. Structural environment of Men+ centers - ESEEM • Radicals and paramagnetic transient metal complexes in biological systems - pulse ENDOR • NO-Fe2+heme protein interactions - HYSCORE (to distinguish between pyrrole Ns and ligand Ns) • Measuring spin-spin distances- DEER (protein labeling), out of phaseESEEM (photochemically generated radical paires, P+700A-1; P+865Q-A) • Direct measuring of T1 and T2 relaxation times.
p/2 p echo 2-pulse spin echo sequence (Hahn echo) t t B0 Z Z Z p p/2 Y Y Y X X X Z Y X
Transient EPR of Light-Induced P700+A1- Radical Pairesin Photosystem I Transient EPR spectrum recorded for a fixed time window after the laser pulse Transient signal S(t) at fixed magnetic field values