Download
1 / 21
210 likes | 219 Vues
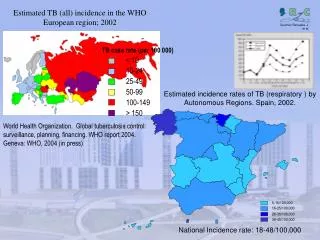
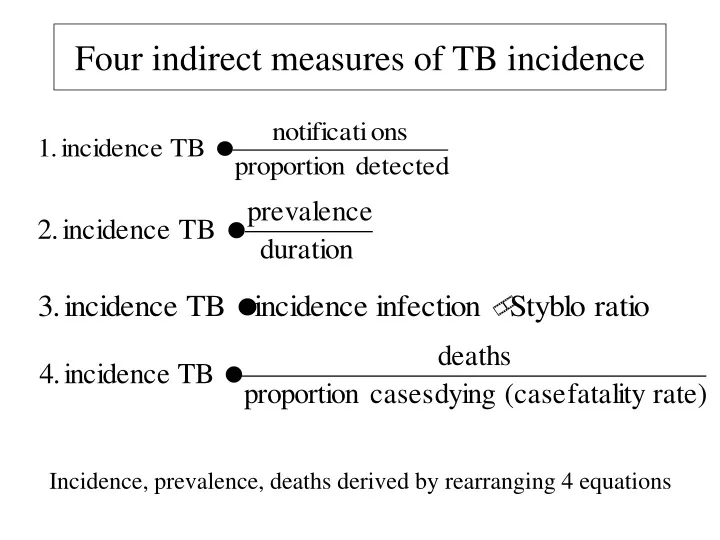
Four indirect measures of TB incidence. Incidence, prevalence, deaths derived by rearranging 4 equations. From infection prevalence. From disease prevalence. 300. 300. ESTIMATING TB INCIDENCE. incidence. 250. 250. falling. 200. 200. b > 50. incidence. ss+/100,000. ss+/100,000.

E N D
Four indirect measures of TB incidence Incidence, prevalence, deaths derived by rearranging 4 equations
From infection prevalence From disease prevalence 300 300 ESTIMATING TB INCIDENCE incidence 250 250 falling 200 200 b > 50 incidence ss+/100,000 ss+/100,000 incidence incidence 150 150 steady b = 50 100 100 weighted duration illness = 2y 50 50 ss+/- HIV+/- DOTS+/- 0 0 0 1 2 3 4 5 6 0 200 400 600 ARI (%/year) prevalence ss+/100,000 From case notifications From HIV prevalence 300 300 250 250 200 200 ss+/100,000 ss+/100,000 incidence incidence 150 150 100 100 no HIV 50 proportion detected = 0.8 50 0 0 0 50 100 150 200 250 0 0.1 0.2 0.3 0.4 notification ss+/100,000 prevalence HIV/100,000
“Proportion detected”: guess from quality of surveillance system e.g. USA probably detects about 95% of cases • More objective e.g. % health units reporting in any year • Beware circular arguments • Method 1 weak with poor surveillance, but strong M&S is the ultimate goal
Disease prevalence from population surveys e.g. Philippines, China, Cambodia • Duration: time span of the condition measured in prevalence survey e.g. ss+ disease • Duration from e.g. patients and physicians asked about reporting and treatment delays (often underestimated)
Estimating mean duration: example • Proportion ss+ cases treated • DOTS 0.4 • non-DOTS 0.5 • untreated 0.1 • Estimated ss+ durations (years): • DOTS 1.0 • non-DOTS 1.5 • untreated 2.0
Prevalence vs incidence: Korean civil servantsTubercle and Lung Disease 76, 534 (1995) • Prevalence PTB 1990 241/100K • Incidence PTB 1989-90 84/100K/yr • Estimated duration = 241/84 = 2.9 years (bigger ratio for older age groups)
Estimating incidence from prevalence: Cambodia prevalence ss+ (survey) 270/100K in 2002 weighted duration DOTS 0.65 @ 1.0 year non DOTS 0.10 @ 1.5 years untreated 0.25 @ 2.0 years = 1.3 years Therefore: incidence ss+ = 282/1.3 = 207/100K/year NB: usually wide range on estimates
Estimating TB incidence from a prevalence survey K = proportion cases found in survey that are already "known" (detected) P = prevalence of TB in survey (known + unknown) δ= rate of detection of prevalent cases t = rate of removal of known cases by treatment (=1/duration recorded as known, e.g. on tx) Example China (?): t = 2/yr, q = 0.4, d = 0.8, 1/d = 1.25 years Incidence = 0.8 x prevalence
Styblo ratio: 1% ARI to 50 ss+/100,000 population (range 40-60) • Accuracy of ARI from tuberculin surveys? • 1:50 breaks down when TB incidence not stable (gets bigger in decline), and in presence of HIV
Accuracy of deaths from vital registration? • Case fatality more accurately measured from observed cohorts (but fate of defaulters, transfers?) • CFR less accurately from unseen patients, whether treated or untreated
Estimating case fatality rate: example • Proportion ss+ cases treated • DOTS 0.4 • non-DOTS 0.5 • untreated 0.1 • Estimated case fatality ss+ (years): • DOTS 0.1 • non-DOTS 0.3 • untreated 0.7
Estimating proportion of TB patients infected with HIV T = AR/[1+A(R-1)] T = proportion TB patients infected with HIV A = proportion adults infected with HIV R = incidence rate ratio (TB incidence in HIV+/TB incidence in HIV-)
TB incidence weakly related to social and economic variables: infant mortality 6.5 6.0 5.5 AF AS 5.0 CA 4.5 EE Ln (estimated TB incidence) SA 4.0 US WP 3.5 ME 3.0 WE Series10 2.5 2.0 1.5 1.5 2.0 2.5 3.0 3.5 4.0 4.5 5.0 5.5 Ln (Infant mortality rate 1991)
Association between the rate of TB among country-of-birth-specific groups in Australia and the rate of TB in the country of birth. From Watkins & Plant 2003.
What’s wrong with the estimation process? • Cannot survey the whole world (infection or disease) • Many estimates are based on guesses about case detection • Estimates often too inaccurate or too biased to judge progress to case detection targets • National estimates do not apply sub-nationally value of exploiting surveillance data