Object Orie’d Data Analysis, Last Time
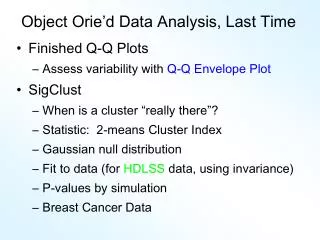
Object Orie’d Data Analysis, Last Time. Finished Q-Q Plots Assess variability with Q-Q Envelope Plot SigClust When is a cluster “really there”? Statistic: 2-means Cluster Index Gaussian null distribution Fit to data (for HDLSS data, using invariance) P-values by simulation

Object Orie’d Data Analysis, Last Time
E N D
Presentation Transcript
Object Orie’d Data Analysis, Last Time • Finished Q-Q Plots • Assess variability with Q-Q Envelope Plot • SigClust • When is a cluster “really there”? • Statistic: 2-means Cluster Index • Gaussian null distribution • Fit to data (for HDLSS data, using invariance) • P-values by simulation • Breast Cancer Data
More on K-Means Clustering Classical Algorithm (from MacQueen,1967) • Start with initial means • Cluster: each data pt. to closest mean • Recompute Class mean • Stop when no change Demo from: http://home.dei.polimi.it/matteucc/Clustering/tutorial_html/AppletKM.html
More on K-Means Clustering Raw Data 2 Starting Centers
More on K-Means Clustering Assign Each Data Point To Nearest Center Recompute Mean Re-assign
More on K-Means Clustering Recompute Mean Re-Assign Data Points To Nearest Center
More on K-Means Clustering Recompute Mean Re-Assign Data Points To Nearest Center
More on K-Means Clustering Recompute Mean Final Assignment
More on K-Means Clustering New Example Raw Data Deliberately Strange Starting Centers
More on K-Means Clustering Assign Clusters To Given Means Note poor clustering
More on K-Means Clustering Recompute Mean Re-assign Shows Improvement
More on K-Means Clustering Recompute Mean Re-assign Shows Improvement Now very good
More on K-Means Clustering Different Example Best 2-means Cluster? Local Minima?
More on K-Means Clustering Assign Recompute Mean Re-assign Note poor clustering
More on K-Means Clustering Recompute Mean Final Assignment Stuck in Local Min
More on K-Means Clustering Same Data But slightly different starting points Impact???
More on K-Means Clustering Assign Recompute Mean Re-assign Note poor clustering
More on K-Means Clustering Recompute Mean Final Assignment Now get Global Min
More on K-Means Clustering ???Next time: Redo above, using my own Matlab calculations That way can show each step And get right answers.
More on K-Means Clustering Now explore starting values: • Approach randomly choose 2 data points • Give stable solutions? • Explore for different point configurations • And try 100 random choices • Do 2-d examples for easy visualization
More on K-Means Clustering 2 Clusters: Raw Data (Normal mixture)
More on K-Means Clustering 2 Clusters: Cluster Index, based on 100 Random Starts
More on K-Means Clustering 2 Clusters: Chosen Clustering
More on K-Means Clustering 2 Clusters Results • All starts end up with good answer • Answer is very good (CI = 0.03) • No obvious local minima
More on K-Means Clustering Stretched Gaussian: Raw Data
More on K-Means Clustering Stretched Gaussian : C. I., based on 100 Random Starts
More on K-Means Clustering Stretched Gaussian : Chosen Clustering
More on K-Means Clustering Stretched Gaussian Results • All starts end up with same answer • Answer is less good (CI = 0.35) • No obvious local minima
More on K-Means Clustering Standard Gaussian: Raw Data
More on K-Means Clustering Standard Gaussian : C. I., based on 100 Random Starts
More on K-Means Clustering Standard Gaussian: Chosen Clustering
More on K-Means Clustering Standard Gaussian Results • All starts end up with same answer • Answer even less good (CI = 0.62) • No obvious local minima • So still stable, despite poor CI
More on K-Means Clustering 4 Balanced Clusters: Raw Data (Normal mixture)
More on K-Means Clustering 4 Balanced Clusters: CI, based on 100 Random Starts
More on K-Means Clustering 4 Balanced Clusters 100 Random Starts • Many different solutions appear • I.e. there are many local minima • Sorting on CI (bottom) shows how many • 2 seem smaller than others • What are other local minima? Understand with deeper visualization
More on K-Means Clustering 4 Balanced Clusters: Class Assignment Image Plot
More on K-Means Clustering 4 Balanced Clusters: Vertically Regroup (better view?)
More on K-Means Clustering 4 Balanced Clusters: Choose cases to “flip” – color cases
More on K-Means Clustering 4 Balanced Clusters: Choose cases to “flip” – color cases
More on K-Means Clustering 4 Balanced Clusters: “flip”, shows local min clusters
More on K-Means Clustering 4 Balanced Clusters: sort columns, for better visualization
More on K-Means Clustering 4 Balanced Clusters: CI, based on 100 Random Starts
More on K-Means Clustering 4 Balanced Clusters: Color according to local minima
More on K-Means Clustering 4 Balanced Clusters: Chosen Clustering, smallest CI
More on K-Means Clustering 4 Balanced Clusters: Chosen Clustering, 2nd small CI
More on K-Means Clustering 4 Balanced Clusters: Chosen Clustering, larger 3rd CI
More on K-Means Clustering 4 Balanced Clusters: Chosen Clustering, larger 4th CI
More on K-Means Clustering 4 Balanced Clusters: Chosen Clustering, larger 5th CI
More on K-Means Clustering 4 Balanced Clusters: Chosen Clustering, larger 6th CI
More on K-Means Clustering 4 Balanced Clusters Results • Many Local Minima • Two good ones appear often (2-2 splits) • 4 worse ones (1-3 splits less common) • 1 with single strange point • Overall very unstable • Raises concern over starting values
More on K-Means Clustering 4 Unbalanced Clusters: Raw Data (try for stability)