
Isotope Simulation Comparisons with Climate Proxy Data
Investigating accuracy of isotopic proxies in climate reconstruction using simulation data and comparisons with proxies. Exploring decadal variability and historical changes in sources of atmospheric moisture.

Isotope Simulation Comparisons with Climate Proxy Data
E N D
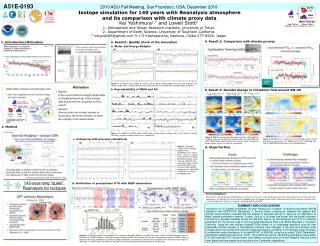
Presentation Transcript
A51E-0193 2010 AGU Fall Meeting, San Francisco, USA, December 2010 Isotope simulation for 140 years with Reanalysis atmosphere and its comparison with climate proxy data Kei Yoshimura1,*and Lowell Stott21: Atmosphere and Ocean Research Institute, University of Tokyo 2: Department of Earth Science, University of Southern California * keiyoshi08@gmail.com 5-1-5 Kashiwanoha, Kashiwa, Chiba 277-8536, Japan 4. Result 2: Comparison with climate proxies 3. Result1: Quality check of the simulation 1. Introduction/Motivation a. Water and Energy Budgets (a) (b) Figure 1: (a) Global water budget (P and E) and (b) global energy budget over land (Net Radiation and latent/sensible heat) in original 20c Reanalysis (blue and red) and IsoGSM 20c simulation (black and green). • Motivation • Specific: Is the current SW-US drought attributable to the global warming? Is the isotopic data able to tell the uniqueness of this event? • General: How accurate are isotopic proxies to reconstruct the recent climate? Is there any change in the relationships? b. Reproducibilityof ENSO and AO 5. Result 3: Decadal change in circulation field around SW-US 2. Method (a) (b) Figure 2: (a) Global SST ENSO index (JISAO, 2010) and (b) Arctic Oscillation index (CPC, 2010) in IsoGSM simulation (shades) and observation (lines), respectively. Figure 5: 500hPa level geopotential height (contours), δD distribution (shades), and mean horizontal wind field (vectors) for 1999-2008 (left), 1959-1968 (middle), and the difference of the two (right). The top and bottom figures are for DJF and JJA, respectively. c. Comparing with previous simulations Figure 6: Meridional cross section of mean wind field (vectors) and δD distribution (anomaly from 1871-2008 mean) for DJF 1959-1968 (top) and for 1999-2008 but differences from the top (bottom). (a) (b) Figure 3: (a) Monthly variation and climatology of global mean precipitation, δ18O, and d-excess. Gray lines indicate ranges of three simulations by SWING member. Green, red, blue, and black lines show GPCP, original 20cR, old IsoGSM-R2 run and the current 20C-IsoGSM, respectively, for 1980-1999. (b) Similar to (a), but for precipitable water. 6. Steps Further 140-year-long “quasi” Reanalysis for Isotopes d. Verification of precipitation δ18O with GNIP observation (a) (c) Acknowledgment We thank Drs. Gil Compo and Jeff Whitaker for assistance us to use 20th century Reanalysis data; Mr. Keitaro Kojima for his help on the coral comparisons; Mr. Mengfan Zhu for sharing the Cambodian tree ring isotope record; and Dr. Masao Kanamitsu for his general assistance from the initial stage of this study. This research is funded by NOAA and JSPS. SUMMARY AND CONCLUSIONS Yoshimura et al. [2008] completed 30-year Reanalysis-"nudged" isotope-incorporated AGCM simulation with NCEP/DOE Reanalysis 2. Several direct comparisons between the dataset and isotope measurements revealed that the dataset is accurate enough to serve as an alternative to water isotope assimilation analysis. Further, Stott et al. [in prep] has shown that the model simulates the history of decadal variability during the late 20th century as reconstructed from δ18O of cellulose extracted from the annual rings of the long-lived Bristlecone Pine from White Mountain in Southern California. Using the new isotope enabled GCM allows us to investigate questions such as how isotopically distinct sources of atmospheric moisture have changed in the past and whether such changes arise from similar and recurrent ocean/atmospheric variability. In the present study we begun to extend the model simulations to include AD1871 to AD2008, using the so-called “20thC Reanalysis” atmospheric dataset [Compo et al., 2010]. The preliminary results indicate the simulated surface water δ18O and cellulose δ18O closely match coral-based reconstructions from the Philippine Sea and some other places and tree-based reconstructions from Cambodia, respectively. (b) Figure 4: (a) Monthly variation of precipitation δ18O anomaly at Bangkok. Red lines are GNIP, blue lines are 20C-IsoGSM, and other lines are from the three SWING members. Light pink and blue shades indicate El-Nino and La-Nina periods respectively derived by the NINO3 index. (b) Seasonal climatology at Bangkok. (c) Global correlation distribution of correlation coefficients for precipitation δ18O anomaly variations against GNIP data. The table shows the number of the GNIP sites where significantly positive correlations are obtained.