Download

1 / 50
500 likes | 634 Vues
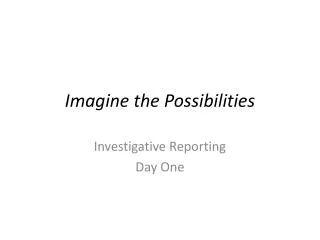
Imagine the possibilities Peg Balachowski Everett Community College. Using Improvement Science to Improve Student Outcomes. “There is no blueprint. We are inventing this together as we go along. “ Anthony Bryk.

E N D
Imagine the possibilitiesPeg BalachowskiEverett Community College
Using Improvement Science to Improve Student Outcomes “There is no blueprint. We are inventing this together as we go along. “ Anthony Bryk
Thanks to Lawrence Morales, Associate for Improvement Science and Jane Muhich, Managing Director for Community College Programs, Director of Productive Persistence for the use of their work.
Outline • Improvement Science • The Model for Improvement • Tools in Improvement Science • Driver Diagrams • PDSA Cycles • Run Charts
Carnegie’s Networked Improvement Community Language & Literacy Productive Persistence Improvement Science Advancing Teaching Analytics
Carnegie’s Pathways • Addressing the Developmental Math challenge with a Pathways approach: • Create a high quality Instructional System • Attend to Language and Literacyissues • Advance Quality Teaching • Sustain a Networked ImprovementCommunity • Promote Productive Persistence
Improvement Science • A field designed to provide a framework for research that is focused on improvement. • Poses questions about a change being tested • Proposes predictions about how the test will go • Uses a testing mechanism to answer questions and verify predictions • Collects data to support conclusions • Analyzes data to inform later iterations of tests
Langley, G. J., et al (2009). The improvement guide: a practical approach to enhancing organizational performance(2nd ed.). San Francisco: Jossey-Bass.
The Model for Improvement (MFI) The Aim The Measures The “Change Ideas”
Three Questions for Guiding Work • What are we trying to accomplish? • How will we know that a change is an improvement? • What changes can we make that will result in an improvement? • One Method for Testing Change • The Plan-Do-Study-Act Cycle (PDSAs)
Tools in Improvement Science 1. Driver Diagrams 2. PDSA Cycles 3. Run Charts
Productive Persistence • The tenacity plusgood strategies that math students need in order to be successful.
Tool 1: The Driver Diagram AIM What are we trying to do? Aim What? Who? By When? Measures: MEASURES How will we know a change is an improvement?
The Driver Diagram AIM What are we trying to do? Primary Secondary Driver A Driver 1 Aim What? Who? By When? Driver B Driver 2 Driver C Driver D Driver 3 Measures: Driver E MEASURES How will we know a change is an improvement?
CHANGE What changes can we test? The Driver Diagram AIM What are we trying to do? Primary Secondary Change Ideas Change Idea Driver A Driver 1 Change Idea Aim What? Who? By When? Driver B Change Idea Driver 2 Driver C Change Idea Driver D Driver 3 Measures: Change Idea Change Idea Driver E MEASURES How will we know a change is an improvement? Change Idea
Primary Drivers Secondary Drivers Secondary Drivers Skills & Habits Aim: Students continue to put forth effort during challenges and when they do so they use effective strategies. Mindsets Secondary Drivers Value Secondary Drivers SocialTies Secondary Drivers Faculty Secondary Drivers
Primary Drivers Students have skills, habits and know-how to succeed in college setting. Aim: Students continue to put forth effort during challenges and when they do so they use effective strategies. Skills and Habits Students believe they are capable of learning math. Mindsets Students believe the course has value. Value Students feel socially tied to peers, faculty, and the course. Social Ties Faculty Faculty and college support students’ skills and mindsets.
Primary Drivers Secondary Drivers Have accurate knowledge about succeeding in the course and navigating The Health Care Data Guide: Learning from Data for Improvementinstitution. Students have skills, habits and know-how to succeed in college setting. Aim: Students continue to put forth effort during challenges and when they do so they use effective strategies. Have the know-how and self-discipline to set and prioritize long and short-term goals over short-term desires and distractions Use learning strategies that are appropriate for the academic challenge they are facing. Have strategies for regulating anxiety. See that math isn’t just a set of algorithms to be memorized but a connected set of concepts that can be understood and applied. Students believe they are capable of learning math. Believe they can actively grow their math ability with effort, help, and good strategies. View math success as something “people like them” do, and not something “other people” do. Students see how completion of this course is relevant to goals for degree/certificate completion. Students believe the course has value. Students believe the knowledge from the course is relevant to a personal or socially-valued goal. Students feel as though they are completing academic tasks for personal reasons. Students feel socially tied to peers, faculty, and the course. Students feel that the professor cares that they, personally, succeed in the course and in college. Possible Measures: Attendance Time on task Strategy use Help-seeking Revising work Challenge-seeking Students feel comfortable asking questions Students do not feel stigmatized due to membership in a negatively stereotyped group. Students do not question whether they belong. Faculty and college support students’ skills and mindsets. Faculty believe students can succeed if they develop more productive skills and mindsets. Faculty know how to promote productive skills and mindsets. Faculty see helping their students to productively persist as part their role as an instructor. Faculty integrate PP principles in how they talk to students and in the curriculum they assign.
Primary Drivers Secondary Drivers Secondary Drivers Skills & Habits Aim: Students continue to put forth effort during challenges and when they do so they use effective strategies. Mindsets Secondary Drivers Value Secondary Drivers SocialTies Secondary Drivers Faculty Secondary Drivers
Primary Driver Secondary Drivers Change Ideas Students feel the professor cares that they succeed Students feel comfortable asking questions SocialTies Students do not doubt their belonging in the course
Primary Driver Secondary Drivers Change Ideas Students feel the professor cares that they succeed • Email routines • Use of names routines • Your ideas? Students feel comfortable asking questions SocialTies Students do not doubt their belonging in the course
Primary Driver Secondary Drivers Change Ideas Students feel the professor cares that they succeed • Email routines • Use of names routines • Your ideas? Students feel comfortable asking questions • Answering routines • Data collection routine • Your ideas? SocialTies Students do not doubt their belonging in the course
Primary Driver Secondary Drivers Change Ideas Students feel the professor caresthat they succeed • Email routines • Use of names routines • Your ideas? Students feel comfortable asking questions • Answering routines • Data collection routine • Your ideas? SocialTies Students do not doubt their belonging in the course • Group role routine • Group noticing routine • Your ideas? CHANGE How do we know these work?
Tool 2: PDSA Cycles • “A way to turn change ideas into action and connect action to learning.”* • A disciplined way to test ideas. • Avoids implementing too soon. *Langley GL, Nolan KM, Nolan TW, Norman CL, Provost LP. The Improvement Guide: A Practical Approach to Enhancing Organizational Performance (2nd edition). San Francisco: Jossey-Bass Publishers; 2009.
PDSA Cycles CHANGE What changes can we test? • “A way to turn change ideas into action and connect action to learning.” • PLAN • What’s the change? • What’s your prediction? • Plan to conduct test • ACT • Next steps: Adapt, adopt, abandon • STUDY • Compare results to prediction • What did you learn? • DO • Execute test • Collect data, • document observations
PDSA Cycles in Productive Persistence Aim: To measure student sense of belonging, develop an efficient way to gather data on the number of students asking questions • Cycle 1: Feedback from ONE student. • Cycle 2: Test with ONE student in class. • Cycle 3: Test with MORE students in class. • Cycles 4-6: Further testing with more students, more than one student at a time, and regular implementation. • Cycle 7: Inform whole class more fully. • Next Step?
References Provost, L. P., & Murray, S. K. (2011). The health care data guide learning from data for improvement. San Francisco, CA: Jossey-Bass.
Tool 3: Run Charts • A graphical display of data to allow you to track outcomes over time.
Run Chart Scenario • Around the 4th week of the term, an instructor is noticing a lot of students are missing class. So she brainstorms and eventually has an idea for how to reduce absences. Her plan is to implement her idea in Week 8 of the semester and then compare data from Week 4 and Week 11 of the semester to see if her idea worked. • Here are her data…. Week 4 Data Week 8 Implement Week 11 Data
Questions to Ponder: • Did this change lead to an improvement? • What questions do you have about the data? • What other factors might be at play? Week 8 Implementation
Group Activity 1) Look at the following 5 Run Charts: Note: Each one has the same data for Weeks 4 & 11 as the bar chart. 2) Decide what conclusions you can make for each case: Did the change lead to improvement? Why or why not?
Week 4 Data Week 8 Implement Week 11 Data Case 1 Conclusion?
Case 2 Conclusion?
Case 3 Conclusion?
Case 4 Conclusion?
Case 5 Conclusion?
How do we know there’s improvement? In all of these Cases, we need to consider the question: “When do the data give us a signal that we have improved on our outcome measure?”
Case 5 Revisited Does this count as an improvement?
Run Chart Rules for Signals Shift: Six or more consecutive points all above or all below the median. (Skip points on the median.) Trend: Five or more consecutive points all going up (increasing) or all going down (decreasing). Astronomical Point: An obvious value different than others in the data set.
Example 1: Are there signals? Note: 3 of 4 of the following examples contain real data and the y-axis units have changed.
Example 1: Analysis • Shifts? • Trends? • Astronomical Points? • None • None • None • No Signals
Example 3 Median = 0.83
Example 3 Median = 0.83
Example 4 Median = 0.78
Example 4 Median = 0.78
Reflections from users • “From hearing the group discussions in the last couple modules—they were teaching themselves. The amount that I had to come to the group[s] and make sure they were on task went down. They were becoming self-learners…. It was wonderful to see.” - Productive Persistence Faculty • “It helped me focus on what was going on with the students, particularly on who was engaged in class. I enjoyed doing the Improvement work and I feel like it really helped me focus on teaching in a different way than I did before.” - Productive Persistence Faculty
Questions? • Thanks for your time! • Peg Balachowski • mbalachowski@everettcc.edu