1 / 7

Chemical Data Analysis Tool for Sample Comparison

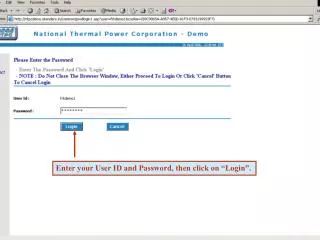
Enter chemical data for one or more samples, then use graphs like Piper Diagram, Durov Diagram, Stiff Diagram, and Ion Balance Diagram to visualize major ion composition, pH, TDS, and cation-anion balance graphically. Analyze and compare fluid samples effectively.

arama
Télécharger la présentation

Chemical Data Analysis Tool for Sample Comparison

An Image/Link below is provided (as is) to download presentation Download Policy: Content on the Website is provided to you AS IS for your information and personal use and may not be sold / licensed / shared on other websites without getting consent from its author. Content is provided to you AS IS for your information and personal use only. Download presentation by click this link. While downloading, if for some reason you are not able to download a presentation, the publisher may have deleted the file from their server. During download, if you can't get a presentation, the file might be deleted by the publisher.

E N D

Presentation Transcript


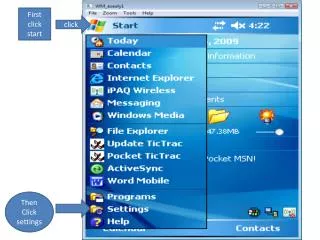
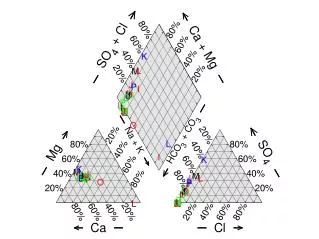
  1. Enter chemical data for one or more samples, then click on Graphs and choose from a number of diagrams. Graphs → Piper Diagram

  2. A Piper Diagram shows the fluid's major ion composition.

  3. A Durov Diagram shows the fluid's major ion composition, pH, and TDS.

  4. A Stiff Diagram represents the fluid's major ion composition as a polygonal shape.

  5. An ion balance diagram (Bar Chart) represents the fluid's cation-anion balance graphically.

More Related