Download
1 / 49
490 likes | 594 Vues
Analyzing the impact of modifications to heart allocation policy implemented on July 12, 2006, on transplant outcomes and waiting list mortality for urgent patients. Explore changes in allocation order and transplant statistics by region, status, and urgency.

E N D
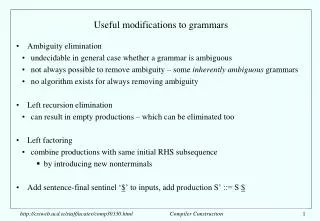
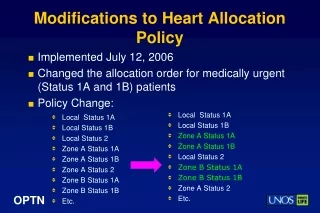
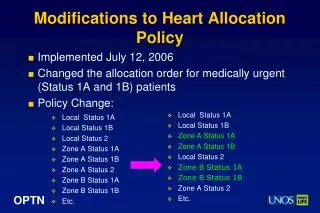
Modifications to Heart Allocation Policy • Implemented July 12, 2006 • Changed the allocation order for medically urgent (Status 1A and 1B) patients • Policy Change: • Local Status 1A • Local Status 1B • Zone A Status 1A • Zone A Status 1B • Local Status 2 • Zone B Status 1A • Zone B Status 1B • Zone A Status 2 • Etc. • Local Status 1A • Local Status 1B • Local Status 2 • Zone A Status 1A • Zone A Status 1B • Zone A Status 2 • Zone B Status 1A • Zone B Status 1B • Etc.
Background • Goals of the Policy: • Reduce waiting list mortality for urgent patients by increasing priority of urgent Status 1A and 1B candidates • This presentation will review changes during the first 12 months following the policy implementation
Composition of Heart Waiting List by Medical Urgency7/5/2006 – 9/19/2007 Based on OPTN data as of September 21, 2007
Number of Active Heart Candidates on the Waiting List by Week and Region7/5/2006 – 9/19/2007 Based on OPTN data as of September 21, 2007
Heart Transplants by recipient age group7/12/2005-7/11/2006 vs. 7/12/2006-7/11/2007 Based on OPTN data as of September 21, 2007
Heart Transplants by Status7/12/2005-7/11/2006 vs. 7/12/2006-7/11/2007 Based on OPTN data as of September 21, 2007
Heart Transplants by Geographic Location7/12/2005-7/11/2006 vs. 7/12/2006-7/11/2007 Based on OPTN data as of September 21, 2007
Heart Transplants by Geographic Location and Medical Urgency Status7/12/2005-7/11/2006 vs. 7/12/2006-7/11/2007 Based on OPTN data as of September 21, 2007
Heart Transplants by Region7/12/2005-7/11/2006 vs. 7/12/2006-7/11/2007 Based on OPTN data as of September 21, 2007
Heart Transplants by Status7/12/2005-7/11/2006 vs. 7/12/2006-7/11/2007Region 1 Based on OPTN data as of September 21, 2007
Heart Transplants by Status7/12/2005-7/11/2006 vs. 7/12/2006-7/11/2007Region 2 Based on OPTN data as of September 21, 2007
Heart Transplants by Status7/12/2005-7/11/2006 vs. 7/12/2006-7/11/2007Region 3 Based on OPTN data as of September 21, 2007
Heart Transplants by Status7/12/2005-7/11/2006 vs. 7/12/2006-7/11/2007Region 4 Based on OPTN data as of September 21, 2007
Heart Transplants by Status7/12/2005-7/11/2006 vs. 7/12/2006-7/11/2007Region 5 Based on OPTN data as of September 21, 2007
Heart Transplants by Status7/12/2005-7/11/2006 vs. 7/12/2006-7/11/2007Region 6 Based on OPTN data as of September 21, 2007
Heart Transplants by Status7/12/2005-7/11/2006 vs. 7/12/2006-7/11/2007Region 7 Based on OPTN data as of September 21, 2007
Heart Transplants by Status7/12/2005-7/11/2006 vs. 7/12/2006-7/11/2007Region 8 Based on OPTN data as of September 21, 2007
Heart Transplants by Status7/12/2005-7/11/2006 vs. 7/12/2006-7/11/2007Region 9 Based on OPTN data as of September 21, 2007
Heart Transplants by Status7/12/2005-7/11/2006 vs. 7/12/2006-7/11/2007Region 10 Based on OPTN data as of September 21, 2007
Heart Transplants by Status7/12/2005-7/11/2006 vs. 7/12/2006-7/11/2007Region 11 Based on OPTN data as of September 21, 2007
Heart Transplants by Status7/12/2005-7/11/2006 vs. 7/12/2006-7/11/2007Region 1 Based on OPTN data as of September 21, 2007
Heart Transplants by Status7/12/2005-7/11/2006 vs. 7/12/2006-7/11/2007Region 2 124 120 79 57 58 36 48 44 18 10 NJTO PADV PATF Based on OPTN data as of September 21, 2007
Heart Transplants by Status7/12/2005-7/11/2006 vs. 7/12/2006-7/11/2007Region 3 69 67 57 49 46 45 30 28 27 26 22 26 20 17 13 12 4 6 FLMP FLUF FLWC GALL LAOP MSOP PRLL Based on OPTN data as of September 21, 2007
Heart Transplants by Status7/12/2005-7/11/2006 vs. 7/12/2006-7/11/2007Region 4 86 83 77 77 32 25 23 15 Based on OPTN data as of September 21, 2007
Heart Transplants by Status7/12/2005-7/11/2006 vs. 7/12/2006-7/11/2007Region 5 175 162 92 93 53 53 40 28 16 13 4 1 Based on OPTN data as of September 21, 2007
Heart Transplants by Status7/12/2005-7/11/2006 vs. 7/12/2006-7/11/2007Region 6 41 31 22 23 1 1 Based on OPTN data as of September 21, 2007
Heart Transplants by Status7/12/2005-7/11/2006 vs. 7/12/2006-7/11/2007Region 7 90 77 65 63 40 39 19 18 Based on OPTN data as of September 21, 2007
Heart Transplants by Status7/12/2005-7/11/2006 vs. 7/12/2006-7/11/2007Region 8 59 50 47 40 33 30 19 14 9 6 Based on OPTN data as of September 21, 2007
Heart Transplants by Status7/12/2005-7/11/2006 vs. 7/12/2006-7/11/2007Region 9 147 126 17 11 10 3 Based on OPTN data as of September 21, 2007
Heart Transplants by Status7/12/2005-7/11/2006 vs. 7/12/2006-7/11/2007Region 10 71 75 64 38 35 32 22 20 19 14 Based on OPTN data as of September 21, 2007
Heart Transplants by Status7/12/2005-7/11/2006 vs. 7/12/2006-7/11/2007Region 11 62 57 54 37 34 26 26 23 19 22 20 20 13 13 Based on OPTN data as of September 21, 2007
Preliminary Results for Death Per 100 Years on the Waiting List: All Statuses Combined11/12/2005-7/11/2006 vs. 7/12/2006-3/11/2007 * Deaths include those reported to the OPTN or to SSDMF while on waiting list or < 7 days of non-transplant removal. Based on OPTN data as of July 6, 2007
Preliminary Results for Death Per 100 Years on the Waiting List: All Ages Combined11/12/2005-7/11/2006 vs. 7/12/2006-3/11/2007 * Deaths include those reported to the OPTN or to SSDMF while on waiting list or < 7 days of non-transplant removal. Based on OPTN data as of July 6, 2007
Summary • Small decline in size of total waiting list candidates • No change in the number of heart transplants comparing pre- and post-policy periods • Substantial change in distribution of transplants by location and status • More Status 1A and Status 1B transplants and fewer Status 2 transplants • Fewer local transplants and more Zone A transplants • Preliminary data suggest a decrease in waiting list mortality rates • Thoracic Committee and Heart Allocation Task Force monitoring impact of policy changes.
Modifications to Kidney Allocation Policy – Pediatric Priority for Donors < 35 years • Implemented on September 28, 2005 • Priority for allocation of kidneys from donors less than 35 years to pediatric candidates listed prior to age 18 locally, regionally, then nationally.
Background • Goal to get “good” kidneys to children quickly with minimal impact on adult candidates • This presentation will review results of the first 18 months following policy implementation
Deceased Donor Kidney TransplantsBy Donor Age and Recipient Age3/28/04 – 9/27/05 vs. 9/28/05 – 3/27/07 Age 11-17 Age 0-5 Age 6-10
Deceased Donor Kidney Transplants, 3/28/04 – 3/27/07By Time Period, Donor Age and Recipient Age Age 6-10 Age 18+ Age 0-5 Age 11-17
Kidney Transplants, 3/28/04 – 3/27/07By Period, Donor Type and Recipient Age Age 6-10 Age 18+ Age 0-5 Age 11-17
Waiting List Removals during 3/28/04 – 3/27/06By Time Period and Age at Listing Age 0-17 Age 18+
Percent Transplanted Within 12 MonthsWL Additions during 9/28/04 – 8/27/06By Policy Period and Age at Listing
Kidney Transplants, 3/28/04 – 3/27/07By Period, DR HLA MM Level and Recipient Age Age 0-17 Age 18+
Pediatric Kidney Waiting List Candidates at Month End for Jan 2005 – May 2007
Pediatric Additions during the Month and Active Pediatric Candidates Waiting at Month End, Jan 2005 – May 2007
Kaplan-Meier Graft Survival by Policy PeriodPediatric Recipients of DD Kidney Transplantsduring 9/28/04-9/27/06 P-value = 0.21
Kaplan-Meier Patient Survival by Policy PeriodPediatric Recipients of DD Kidney Transplantsduring 9/28/04-9/27/06 P-value = 0.76
Summary • Preliminary results show that the number and percentage of pediatric kidney transplants from deceased donors less than age 35 has increased since the policy change, and fewer pediatric candidates are waiting for a transplant. • Deceased donor transplantation appears to be occurring more rapidly among pediatric recipients. • The number of living donor pediatric kidney transplants appears to have decreased, and this will be closely monitored.
Summary • The number and percent of less well HLA matched transplants increased after the policy implementation. • Graft and patient survival for transplants performed during the 12 months before the policy and 12 months after the policy implementation were not significantly different. • Pediatric and Kidney Committees monitoring impact of the policy change.