HEART ALLOCATION SYSTEM DATA UPDATE
HEART ALLOCATION SYSTEM DATA UPDATE. Fall 2010 Regional Meetings. Based on OPTN data as of July 16, 2010. Heart Allocation Policy. Allocation for pediatric donors*: Local + Zone A Status 1A ped. cand. Local Status 1A adult cand. Local + Zone A Status 1B ped. cand.

HEART ALLOCATION SYSTEM DATA UPDATE
E N D
Presentation Transcript
HEART ALLOCATION SYSTEMDATA UPDATE Fall 2010 Regional Meetings Based on OPTN data as of July 16, 2010
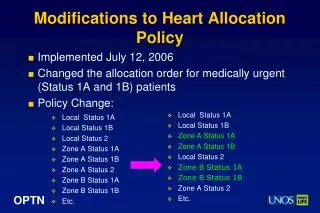
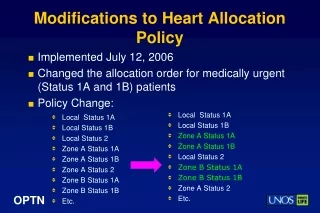
Heart Allocation Policy • Allocation for pediatric donors*: • Local + Zone A Status 1A ped. cand. • Local Status 1A adult cand. • Local + Zone A Status 1B ped. cand. • Local Status 1B adult cand. • Zone A Status 1A adult cand. • Zone A Status 1B adult cand. • Local Status 2 ped. cand. • Local Status 2 adult cand. • Zone B Status 1A ped. cand. • Zone B Status 1A adult cand. • Zone B Status 1B ped. cand. • Zone B Status 1B adult cand. • Zone A Status 2 ped. cand. • Zone A Status 2 adult cand. • Etc. • Modified on July 12, 2006 • Allocation for adult donors: • Local Status 1A • Local Status 1B • Zone A Status 1A • Zone A Status 1B • Local Status 2 • Zone B Status 1A • Zone B Status 1B • Zone A Status 2 • Etc. * Modifications to Policy 3.7 for pediatric donors were implemented on May 6, 2009.
HEART CANDIDATE STATUS DISTRIBUTION • On 7/12/06 there were 2896 candidates (1307 active) • On 7/14/10 there were 3146 candidates (2099 active)
DEATHS PER 100 PATIENT-YEARS ON THE WAITING LIST: Stratified by Age GroupCombining Active Statuses with Corresponding Status 7 Groups NOTE: Caution should be used in drawing conclusions based on death rates due to differences in patient populations. * Deaths include those reported to the OPTN or to SSDMF while on waiting list or within 7 days of non-transplant removal.
HEART TRANSPLANTS PERFORMED BY REGIONBetween 7/12/03-5/11/06 and 7/12/06-5/11/10
PERCENTAGE OF STATUS 2 HEART TRANSPLANTS PERFORMED AT EACH CENTER
TRANSPLANTS BY ERA AND ZONE: ADULTS VS. PEDIATRICS Adults Pediatrics
SURVIVAL WITHIN 2 YEARS:Adult recipients: All statuses combined NOTE: Scale of survival axis has been expanded.
SURVIVAL WITHIN 2 YEARS:Pediatric recipients: All statuses combined NOTE: Scale of survival axis has been expanded.
SUMMARY – WAITING LIST • There has been an increase in the number of active waiting list registrations and urgent waiting list registrations • Waiting list mortality in Status 1A and Status 1B appears to have decreased
SUMMARY – TRANSPLANT • The number of transplants has remained essentially flat over the past 3 years. • The distribution of status at transplant has changed: ↑ Status 1A and ↓ Status 2. • There is no significant change in post-transplant survival within 2 years for adults or pediatrics, overall or by status at transplant.
LUNG ALLOCATION SCORE SYSTEMDATA UPDATEFall 2010 Regional Meetings Based on OPTN data as of July 23, 2010
LUNG ALLOCATION SCORE STATUSFor All Registrations N=3865 N=1865 NOTE: As of November 2, 2005, candidates with a zero LAS have been screened from match runs.
ACTIVE LUNG AND HEART-LUNG REGISTRATIONS (12+) WITH NON-ZERO SCOREOn July 23, 2010, by Region and Age Group (1)
ACTIVE LUNG AND HEART-LUNG REGISTRATIONS (12+) WITH NON-ZERO SCOREOn July 23, 2010, by Region and Age Group (2)
CALCULATED LAS AT TIME OF LISTING FOR LUNG AND HEART-LUNG REGISTRATIONS (12+)Excluding 0 LAS
DEATHS PER 100 PATIENT YEARS: LU candidates ever waiting (12+ years at time of listing) NOTE: Caution should be used in drawing conclusions based on death rates due to differences in patient populations and the small number of deaths in some groups. * Deaths include those reported to the OPTN or to SSDMF while on waiting list or < 7 days of non-transplant removal
DECEASED DONOR LUNG AND HEART-LUNG TRANSPLANTS: 5/4/04-5/3/10
DECEASED DONOR LUNG AND HEART-LUNG TRANSPLANTS: 5/4/04-5/3/10By Diagnosis Grouping
DISTRIBUTION OF LAS AT TRANSPLANT BY REGION: 5/4/2005-5/3/2010
POST-TRANSPLANT SURVIVAL WITHIN 2 YEARSWITHOUT CONFIDENCE LIMITSFor Recipients 12+ Years
SUMMARY – WAITING LIST The total number of WL candidates is substantially lower than prior to the implementation of LAS. The number of active candidates 12+ years has increased during the most recent two years. The distribution of LAS at listing has shifted towards higher scores in the years since implementation The waiting list mortality is lower overall in the post-policy era compared to the pre-policy era. This same pattern was seen within all diagnosis groups.
SUMMARY – TRANSPLANT The percentage of lungs transplanted has increased from pre- to post-LAS. There was a huge increase in the number of transplants from pre-LAS to post-LAS. There was also a large increase in transplants during the most recent complete year. There has been a substantial shift in the distribution of diagnosis from pre-LAS (>50% group A) to post-LAS (>50% group D). Post-transplant survival is comparable pre- and post-LAS, overall and by diagnosis grouping.