Lecture 3 Trace Metals in Seawater
380 likes | 586 Vues
Lecture 3 Trace Metals in Seawater. What are trace elements? Why are they important? Principal of Oceanographic Consistency. Profiles shapes as clues for controlling processes. A first look at spatial variation. What are the different “ types ” of elements?. Trace elements in seawater

Lecture 3 Trace Metals in Seawater
E N D
Presentation Transcript
Lecture 3 Trace Metals in Seawater What are trace elements? Why are they important? Principal of Oceanographic Consistency. Profiles shapes as clues for controlling processes.
A first look at spatial variation What are the different “types” of elements?
Trace elements in seawater Definition: Those elements that do not contribute to salinity All elements less than 1 mg kg-1(<1 ppm) Why are they important? 1. many are micronutrients (e.g. Fe, Cu) – speciation is important 2. others are toxic (e.g. Cu, Hg) 3. some are tracers for redox conditions (Mn, Fe, Cr, I, Re, Mo, V, U) 4. some are enriched in economic deposits such as manganese nodules (e.g. Cu, Co, Ni, Cd) 5. some have man made sources and are tracers of pollution (e.g. Pb, Pu, Ag) ** Difficult to collect samples for without contamination and difficult to analyze.
Oceanographic consistency • Acceptance of data must satisfy two criteria: • Vertical profiles should be smooth, not spiky. • Ocean mixing produces smooth profiles • 2. Correlations should exist with other elements that • share the same controlling mechanisms. First Example – Cu in surface waters south of New Zealand (Boyle and Edmond, 1975, Nature, 253, 107) PO4 NO3 Si - SST
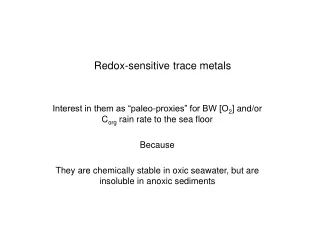
Shapes of Profiles – clues for controls Conservative- Cesium (Cs); Molybdenum (Mo) - under oxic conditions Nutrient Like – Biological control Shallow (soft parts) and Deep (hard parts) Regeneration Zinc (Zn) Cadmium (Cd) Nickel (Ni) Copper (Cu) Barium (Ba) Surface Enrichment – Atm input, River/Coastal inputs Lead (Pb) Manganese (Mn) Mid-depth Maximum – Hydrothermal inputs, Oxygen minimum Manganese (Mn) Iron (Fe) Near Bottom Enrichment – sediment source North Sea Metals (Cd, Cu, Mn) Deep Depletion - scavenging Lead-210 Aluminum (Al) Manganese (Mn) Copper (Cu)
Nutrient Like Profiles Superposition of vertical biological flux on horizontal circulation Results in low surface water and high deep water concentrations. Results in higher concentrations in the older deep Pacific than the younger deep Atlantic
Example: Comparison of vertical profiles of nutrients from the Atlantic and Pacific PO4 Si Notice differences in shape
Nutrient Like Examples Cd, Zn, Cu, Ni But what about Mn, Pb ??
Ba Nutrient Like- Deep Regeneration- Hard Parts Ba and Si strongly correlated. But Why??
Cd Nutrient Like- Shallow Regeneration- Soft Parts Cd and PO4 strongly correlated. But Why??
Modern Data Use the Cd-PO4 correlation as a tool to determine paleo PO4 concentrations. Paleo Reconstruction
Al Atmospheric Input and Scavenging Al profiles Mediterranean to Atlantic to Pacific
Mid-depth Maximum (~200 – 1000m) Mn Depth (km) Depth (km) Total Dissolved Oxygen Minimum Zone - ETNP Murray et al (1981)
Mid-Depth Maximum (~2000m) Fe and Mn Hydrothermal plume from the Juan de Fuca Ridge T anomaly particles Mn Fe Coale et al (1991) Nature, 352, 325
Pb Atmospheric input Pb in Greenland snow
Atmospheric Input Anthropogenic Origin Pb Surface Maximum Flegal and Patterson, 1983
MIT Pb concentration data (Boyle) from US GT NAT-2010 transect compared to MIT data from nearby stations from 1989 and 1999.
Echegoyen-Sanz and Boyle (unpublished). (Boyle and Jenkins, in preparation),
Sediment Source High Trace Metal Concentrations on the Continental Shelf S PO4 Si Cd Cu Mn Kremling (1983) Nature 303, 225
Ocean Periodic Table (from Ken Johnson, MBARI) http://www.mbari.org/chemsensor/pteo.htm Then click on any element of interest for example profiles.
Metal Limitation and Toxicity – Cu – Role of Free Metal Ion Cu Speciation and Plankton Growth pCu = - log Cu2+ Cutotal = Cu2+ + inorganic complexes + organic complexes
Cu Speciation – Ocean Distributions Total Copper Strong Organic Ligands Free Cu2+ Total Cu
Mn Multiple Controls
Classification of elements Conservative (or “bio-unlimited”) Bio-limiting (and “biointermediate”) Scavenged Some have a style of their own (e.g. O, Ar, Bi, Hg)