Relative RNA expression (2 - ΔΔ Ct )
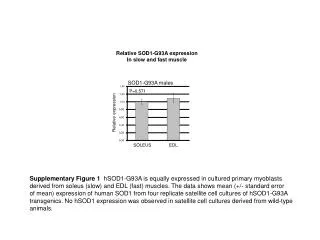
120 likes | 292 Vues
Abat. Sult1a1. 1.0. 1.25. 0.8. 1.0. 0.6. Relative RNA expression (2 - ΔΔ Ct ). Relative RNA expression (2 - ΔΔ Ct ). 0.75. 0.4. 0.5. 0.2. 0.25. 0. 0. Gsk3 β. Myd116. 4.0. 6.0. 3.0. 4.0. Relative RNA expression (2 - ΔΔ Ct ). Relative RNA expression (2 - ΔΔ Ct ). 2.0. 2.0.

Relative RNA expression (2 - ΔΔ Ct )
E N D
Presentation Transcript
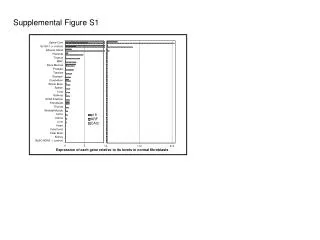
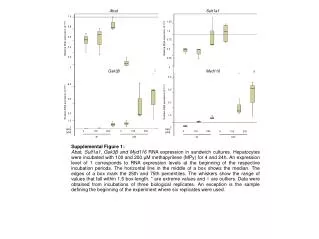
Abat Sult1a1 1.0 1.25 0.8 1.0 0.6 Relative RNA expression (2-ΔΔCt) Relative RNA expression (2-ΔΔCt) 0.75 0.4 0.5 0.2 0.25 0 0 Gsk3β Myd116 4.0 6.0 3.0 4.0 Relative RNA expression (2-ΔΔCt) Relative RNA expression (2-ΔΔCt) 2.0 2.0 1.0 1.0 0 0 MPy [µM] MPy [µM] 0 100 200 0 100 200 0 100 200 0 100 200 Supplemental Figure 1: Abat, Sult1a1, Gsk3β and Myd116 RNA expression in sandwich cultures. Hepatocytes were incubated with 100 and 200 µM methapyrilene (MPy) for 4 and 24h. An expression level of 1 corresponds to RNA expression levels at the beginning of the respective incubation periods. The horizontal line in the middle of a box shows the median. The edges of a box mark the 25th and 75th percentiles. The whiskers show the range of values that fall within 1.5 box-length. * are extreme values and ○ are outliers. Data were obtained from incubations of three biological replicates. An exception is the sample defining the beginning of the experiment where six replicates were used. 4h 24h 4h 24h
Abat Sult1a1 4.0 2.0 3.0 1.5 Relative RNA expression (2-ΔΔCt) Relative RNA expression (2-ΔΔCt) 2.0 1.0 0.5 1.0 0 0 Gsk3β Myd116 6.0 5.0 5.0 4.0 4.0 3.0 Relative RNA expression (2-ΔΔCt) Relative RNA expression (2-ΔΔCt) 3.0 2.0 2.0 1.0 1.0 0 0 MPy [µM] MPy [µM] 0 100 200 0 100 200 0 100 200 0 100 200 Supplemental Figure 2: Abat, Sult1a1, Gsk3β and Myd116 RNA expression in sandwich cultures. The same experimental design as described for Supplemental Figure 1 was used. (First repeated experiment) 4h 24h 4h 24h
Abat Sult1a1 4.0 2.0 3.0 1.5 Relative RNA expression (2-ΔΔCt) Relative RNA expression (2-ΔΔCt) 2.0 1.0 1.0 0.5 0 0 Gsk3β Myd116 8.0 10.0 8.0 6.0 6.0 Relative RNA expression (2-ΔΔCt) Relative RNA expression (2-ΔΔCt) 4.0 4.0 2.0 2.0 1.0 1.0 0 0 MPy [µM] MPy [µM] 0 100 200 0 100 200 0 100 200 0 100 200 Supplemental Figure 3: Abat, Sult1a1, Gsk3β and Myd116 RNA expression in sandwich cultures. The same experimental design as described for Supplemental Figure 1 was used. (Second repeated experiment) 4h 24h 4h 24h
Abat Sult1a1 1.2 4.0 1.0 3.0 0.8 Relative RNA expression (2-ΔΔCt) Relative RNA expression (2-ΔΔCt) 2.0 0.6 0.4 1.0 0.2 0 0 Gsk3β Myd116 5.0 5.0 4.0 4.0 3.0 3.0 Relative RNA expression (2-ΔΔCt) Relative RNA expression (2-ΔΔCt) 2.0 2.0 1.0 1.0 0 0 MPy [µM] MPy [µM] 0 100 200 0 100 200 0 100 200 0 100 200 Supplemental Figure 4: Abat, Sult1a1, Gsk3β and Myd116 RNA expression in Matrigel cultures. Hepatocytes were incubated with 100 and 200 µM methapyrilene (MPy) for 4 and 24h. An expression level of 1 corresponds to RNA expression levels at the beginning of the respective incubation periods. The horizontal line in the middle of a box shows the median. The edges of a box mark the 25th and 75th percentiles. The whiskers show the range of values that fall within 1.5 box-length. * are extreme values and ○ are outliers. Data were obtained from incubations of three biological replicates. An exception is the sample defining the beginning of the experiment where six replicates were used. 4h 24h 4h 24h
Abat Sult1a1 2.5 1.2 1.0 2.0 0.8 1.5 Relative RNA expression (2-ΔΔCt) Relative RNA expression (2-ΔΔCt) 0.6 1.0 0.4 0.5 0.2 0 0 Gsk3β Myd116 4.0 4.0 3.0 3.0 Relative RNA expression (2-ΔΔCt) Relative RNA expression (2-ΔΔCt) 2.0 2.0 1.0 1.0 0 0 MPy [µM] MPy [µM] 0 100 200 0 100 200 0 100 200 0 100 200 Supplemental Figure 5: Abat, Sult1a1, Gsk3β and Myd116 RNA expression in Matrigel cultures. The same experimental design as described for Supplemental Figure 4 was used. (First repeated experiment) 4h 24h 4h 24h
Abat Sult1a1 2.5 2.5 2.0 2.0 1.5 1.5 Relative RNA expression (2-ΔΔCt) Relative RNA expression (2-ΔΔCt) 1.0 1.0 0.5 0.5 0 0 Gsk3β Myd116 4.0 6.0 5.0 3.0 4.0 Relative RNA expression (2-ΔΔCt) Relative RNA expression (2-ΔΔCt) 3.0 2.0 2.0 1.0 1.0 0 0 MPy [µM] MPy [µM] 0 100 200 0 100 200 0 100 200 0 100 200 Supplemental Figure 6: Abat, Sult1a1, Gsk3β and Myd116 RNA expression in Matrigel cultures. The same experimental design as described for Supplemental Figure 4 was used. (Second repeated experiment) 4h 24h 4h 24h
Abat Sult1a1 10.0 25.0 8.0 20.0 6.0 15.0 Relative RNA expression (2-ΔΔCt) Relative RNA expression (2-ΔΔCt) 4.0 10.0 2.0 5.0 1.0 0 0 Gsk3β Myd116 15.0 40.0 30.0 10.0 Relative RNA expression (2-ΔΔCt) Relative RNA expression (2-ΔΔCt) 20.0 5.0 10.0 0 0 MPy [µM] MPy [µM] 0 100 200 0 100 200 0 100 200 0 100 200 Supplemental Figure 7: Abat, Sult1a1, Gsk3β and Myd116 RNA expression in Matrigel cultures. The same experimental design as described for Supplemental Figure 4 was used. The 4h 200 µM gene expression was out of range of all other values and was not used for the summary of the data shown in Figure 1. (Third repeated experiment) 4h 24h 4h 24h
Abat Sult1a1 2.0 1.2 1.0 1.5 0.8 Relative RNA expression (2-ΔΔCt) Relative RNA expression (2-ΔΔCt) 0.6 1.0 0.4 0.5 0.2 0 0 Gsk3β Myd116 5.0 5.0 4.0 4.0 3.0 3.0 Relative RNA expression (2-ΔΔCt) Relative RNA expression (2-ΔΔCt) 2.0 2.0 1.0 1.0 0 0 MPy [µM] MPy [µM] 0 100 200 0 100 200 0 100 200 0 100 200 Supplemental Figure 8: Abat, Sult1a1, Gsk3β and Myd116 RNA expression in 2D cultures. Hepatocytes were incubated with 100 and 200 µM methapyrilene (MPy) for 4 and 24h. An expression level of 1 corresponds to RNA expression levels at the beginning of the respective incubation periods. The horizontal line in the middle of a box shows the median. The edges of a box mark the 25th and 75th percentiles. The whiskers show the range of values that fall within 1.5 box-length. * are extreme values and ○ are outliers. Data were obtained from incubations of three biological replicates. An exception is the sample defining the beginning of the experiment where six replicates were used. 4h 24h 4h 24h
Abat Sult1a1 1.2 1.2 1.0 1.0 0.8 0.8 Relative RNA expression (2-ΔΔCt) Relative RNA expression (2-ΔΔCt) 0.6 0.6 0.4 0.4 0.2 0.2 0 0 Gsk3β Myd116 6.0 6.0 5.0 5.0 4.0 4.0 Relative RNA expression (2-ΔΔCt) Relative RNA expression (2-ΔΔCt) 3.0 3.0 2.0 2.0 1.0 1.0 0 0 MPy [µM] MPy [µM] 0 100 200 0 100 200 0 100 200 0 100 200 Supplemental Figure 9: Abat, Sult1a1, Gsk3β and Myd116 RNA expression in 2D cultures. The same experimental design as described for Supplemental Figure 8 was used. (First repeated experiment) 4h 24h 4h 24h
Abat Sult1a1 2.0 1.2 1.0 1.5 0.8 Relative RNA expression (2-ΔΔCt) Relative RNA expression (2-ΔΔCt) 0.6 1.0 0.4 0.5 0.2 0 0 Gsk3β Myd116 2.5 1.25 2.0 1.0 1.5 0.75 Relative RNA expression (2-ΔΔCt) Relative RNA expression (2-ΔΔCt) 1.0 0.5 0.5 0.25 0 0 MPy [µM] MPy [µM] 0 100 200 0 100 200 0 100 200 0 100 200 Supplemental Figure 10: Abat, Sult1a1, Gsk3β and Myd116 RNA expression in 2D cultures. The same experimental design as described for Supplemental Figure 8 was used. (Second repeated experiment) 4h 24h 4h 24h
100 80 60 cell viability [%] 40 20 Supplemental Figure 11: Cytotoxicity of methapyrilene (MPy) using the LDH-release assay: Sandwich cultures of primary rat hepatocytes were incubated with methapyrilene at different concentrations (1.5, 3, 6.25, 12.5, 25, 50, 100, 200, 400, 800 µM) for 24 h. Using the LDH-release assay, the cytotoxicity of MPy was determined. Data are mean values and standard deviations of three independent incubations. 1 10 100 MPy [µM]
1.0 6.0 A Abat C Gsk3β 5.0 0.8 4.0 0.6 Relative RNA expression (2-ΔΔCt) Relative RNA expression (2-ΔΔCt) 3.0 0.4 2.0 0.2 1.0 0 0 B Sult1a1 D Myd116 4.0 1.2 1.0 3.0 0.8 Relative RNA expression (2-ΔΔCt) Relative RNA expression (2-ΔΔCt) 2.0 0.6 0.4 1.0 0.2 Supplemental Figure 12: Abat (A), Sult1a1 (B), Gsk3β (C) and Myd116 (D) expression after incubation for 24 h with different concentrations of methapyrilene (MPy): Sandwich cultures of primary rat hepatocytes were incubated with MPy at different concentrations (0.002, 0.02, 0.39, 6.25, 100 µM) for 24 h. An expression level of 1 corresponds to RNA expression levels at the beginning of the incubation period. The horizontal line in the middle of a box shows the median. The edges of a box mark the 25th and 75th percentiles. The whiskers show the range of values that fall within 1.5 box-length. Data were obtained from three independent incubations. 0 0 C MPy C MPy C MPy C MPy C MPy C MPy C MPy C MPy C MPy C MPy MPy [µM] MPy [µM] 0.002 0.02 0.002 0.02 0.39 6.25 100 0.39 6.25 100