Gene Expression - Microarrays
Gene Expression - Microarrays. Misha Kapushesky European Bioinformatics Institute, EMBL St. Petersburg, Russia May 2010. Compare gene expression in this cell type…. …after viral infection. …relative to a knockout. …in samples from patients. …after drug treatment. …at a later


Gene Expression - Microarrays
E N D
Presentation Transcript
Gene Expression - Microarrays Misha Kapushesky European Bioinformatics Institute, EMBL St. Petersburg, Russia May 2010
Compare gene expression in this cell type… …after viral infection …relative to a knockout …in samples from patients …after drug treatment …at a later developmental time …in a different body region
Gene expression is context-dependent, and is regulated in several basic ways • • by region (e.g. brain versus kidney) • • in development (e.g. fetal versus adult tissue) • • in dynamic response to environmental signals • (e.g. immediate-early response genes) • in disease states • by gene activity Page 297
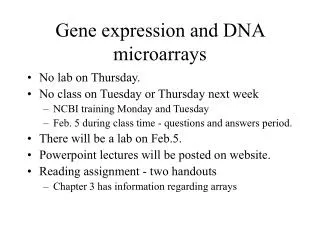
Outline: microarray data analysis Gene expression Microarrays Preprocessing normalization scatter plots Inferential statistics t-test ANOVA Exploratory (descriptive) statistics distances clustering principal components analysis (PCA)
Microarrays: tools for gene expression A microarray is a solid support (such as a membrane or glass microscope slide) on which DNA of known sequence is deposited in a grid-like array. Page 312
Microarrays: tools for gene expression The most common form of microarray is used to measure gene expression. RNA is isolated from matched samples of interest. The RNA is typically converted to cDNA, labeled with fluorescence (or radioactivity), then hybridized to microarrays in order to measure the expression levels of thousands of genes.
Measuring RNA abundances ostolop@ebi.ac.uk
How it works • Complementary hybridization: • Put a part of the gene sequence on the array • convert mRNA to cDNA using reverse transcriptase ostolop@ebi.ac.uk
Spotted Arrays • Robot puts little spots of DNA on glass slides • Each spot is a DNA analog of the mRNA we want to detect ostolop@ebi.ac.uk
Spotted Arrays • Two channel technology for comparing two samples – relative measurements • Two mRNA samples (reference, test) are reverse transcribed to cDNA, labeled with fluorescent dyes (Cy3, Cy5) and allowed to hybridize to array ostolop@ebi.ac.uk
Spotted Arrays • Read out two images by scanning array with lasers, one for each dye ostolop@ebi.ac.uk
Oligonucleotide Arrays • One channel technology – absolute measurements • Instead of putting entire genes on array, put multiple oligonucleotide probes: short, fixed length DNA sequences (25-60 nucleotides) • Oligos are synthesized in situ • Affymetrix uses a photolithography process, similar to that used to make semiconductor chips • Other technologies available (e.g. mirror arrays) ostolop@ebi.ac.uk
Oligonucleotide Arrays • For each gene, construct a probeset – a set of n-mers to specific to this gene ostolop@ebi.ac.uk
Advantages of microarray experiments Fast Data on >20,000 transcripts within weeks Comprehensive Entire yeast or mouse genome on a chip Flexible Custom arrays can be made to represent genes of interest Easy Submit RNA samples to a core facility Cheap? Chip representing 20,000 genes for $300
Disadvantages of microarray experiments Cost ■ Some researchers can’t afford to do appropriate numbers of controls, replicates RNA ■ The final product of gene expression is protein significance ■ “Pervasive transcription” of the genome is poorly understood (ENCODE project) ■ There are many noncoding RNAs not yet represented on microarrays Quality ■ Impossible to assess elements on array surface control ■ Artifacts with image analysis ■ Artifacts with data analysis ■ Not enough attention to experimental design ■ Not enough collaboration with statisticians
Sample acquisition Data acquisition Data analysis Data confirmation Biological insight
Stage 1:Experimental design Stage 2:RNA and probe preparation Stage 3: Hybridization to DNA arrays Stage 4: Image analysis Stage 5: Microarray data analysis Stage 6: Biological confirmation Stage 7: Microarray databases
Stage 1: Experimental design [1] Biological samples: technical and biological replicates: determine the data analysis approach at the outset [2] RNA extraction, conversion, labeling, hybridization: except for RNA isolation, routinely performed at core facilities [3] Arrangement of array elements on a surface: randomization can reduce spatially-based artifacts Page 314
Stage 2: RNA preparation For Affymetrix chips, need total RNA (about 5 ug) Confirm purity by running agarose gel Measure a260/a280 to confirm purity, quantity One of the greatest sources of error in microarray experiments is artifacts associated with RNA isolation; appropriately balanced, randomized experimental design is necessary.
Stage 3: Hybridization to DNA arrays The array consists of cDNA or oligonucleotides Oligonucleotides can be deposited by photolithography The sample is converted to cRNA or cDNA (Note that the terms “probe” and “target” may refer to the element immobilized on the surface of the microarray, or to the labeled biological sample; for clarity, it may be simplest to avoid both terms.)
Stage 4: Image analysis RNA transcript levels are quantitated Fluorescence intensity is measured with a scanner.
Differential Gene Expression on a cDNA Microarray Control a B Crystallin is over-expressed in Rett Syndrome Rett
Fig. 8.21 Page 319
Fig. 8.21 Page 319
Stage 5: Microarray data analysis • Hypothesis testing • How can arrays be compared? • Which RNA transcripts (genes) are regulated? • Are differences authentic? • What are the criteria for statistical significance? • Clustering • Are there meaningful patterns in the data (e.g. groups)? • Classification • Do RNA transcripts predict predefined groups, such as disease subtypes? Page 318
Stage 6: Biological confirmation Microarray experiments can be thought of as “hypothesis-generating” experiments. The differential up- or down-regulation of specific RNA transcripts can be measured using independent assays such as -- Northern blots -- polymerase chain reaction (RT-PCR) -- in situ hybridization Page 320
Stage 7: Microarray databases There are two main repositories: Gene Expression Omnibus (GEO) at NCBI ArrayExpress at the European Bioinformatics Institute (EBI)
Microarray Slide (with 60,000 or more spotted genes) Microtiter Plate Microbial ORFs + Design PCR Primers PCR Products Eukaryotic Genes Select cDNA clones Many different plates containing different genes For each plate set, many identical replicas PCR Products Microarray Overview I
Microarray Overview II Measure Fluorescence in 2 channels red/green Control Hybridize, Wash Analyze the data to identifypatterns ofgene expression Test Prepare Fluorescently Labeled Probes
Affymetrix GeneChip™ Expression Analysis Hybridize and wash chips Scan chips Analyze Control Test PM Prepare Fluorescently LabeledProbes Obtain RNASamples MM
Microarray Expression Analysis Differential State/Stage Selection Tissue Selection RNA Preparation and Labeling Competitive Hybridization Spots on an Array Expression Measurement Fluorescence Intensity Gene
Steps in the Process Select array elements and annotate them Build a database to manage stuff Print arrays and manage the lab Hybridize and analyze images; manage data Analyze hybridization data and get results
MIAME In an effort to standardize microarray data presentation and analysis, Alvis Brazma and colleagues at 17 institutions introduced Minimum Information About a Microarray Experiment (MIAME). The MIAME framework standardizes six areas of information: ►experimental design ►microarray design ►sample preparation ►hybridization procedures ►image analysis ►controls for normalization Visit http://www.mged.org
Interpretation of RNA analyses The relationship of DNA, RNA, and protein: DNA is transcribed to RNA. RNA quantities and half-lives vary. There tends to be a low positive correlation between RNA and protein levels. The pervasive nature of transcription: The Encyclopedia of DNA Elements (ENCODE) project identified functional features of genomic DNA, initially in 30 megabases (1% of the human genome). One of its observations was the “pervasive nature of transcription”: the vast majority of DNA is transcribed, although the function is unknown.
Outline: microarray data analysis Gene expression Microarrays Preprocessing normalization scatter plots Inferential statistics t-test ANOVA Exploratory (descriptive) statistics distances clustering principal components analysis (PCA)
Microarray data analysis • begin with a data matrix (gene expression values versus samples) genes (RNA transcript levels)
Microarray data analysis • begin with a data matrix (gene expression values versus samples) Typically, there are many genes (>> 20,000) and few samples (~ 10) Fig. 9.1 Page 333
Microarray data analysis • begin with a data matrix (gene expression values versus samples) Preprocessing Inferential statistics Descriptive statistics
Microarray data analysis: preprocessing • Observed differences in gene expression could be • due to transcriptional changes, or they could be • caused by artifacts such as: • different labeling efficiencies of Cy3, Cy5 • uneven spotting of DNA onto an array surface • variations in RNA purity or quantity • variations in washing efficiency • variations in scanning efficiency
Microarray data analysis: preprocessing The main goal of data preprocessing is to remove the systematic bias in the data as completely as possible, while preserving the variation in gene expression that occurs because of biologically relevant changes in transcription. A basic assumption of most normalization procedures is that the average gene expression level does not change in an experiment.
Data analysis: global normalization Global normalization is used to correct two or more data sets. In one common scenario, samples are labeled with Cy3 (green dye) or Cy5 (red dye) and hybridized to DNA elements on a microrarray. After washing, probes are excited with a laser and detected with a scanning confocal microscope.
Data analysis: global normalization Global normalization is used to correct two or more data sets Example: total fluorescence in Cy3 channel = 4 million units Cy 5 channel = 2 million units Then the uncorrected ratio for a gene could show 2,000 units versus 1,000 units. This would artifactually appear to show 2-fold regulation.
Data analysis: global normalization Global normalization procedure Step 1: subtract background intensity values (use a blank region of the array) Step 2: globally normalize so that the average ratio = 1 (apply this to 1-channel or 2-channel data sets)
Scatter plots Useful to represent gene expression values from two microarray experiments (e.g. control, experimental) Each dot corresponds to a gene expression value Most dots fall along a line Outliers represent up-regulated or down-regulated genes