Gene expression and DNA microarrays
180 likes | 484 Vues
Gene expression and DNA microarrays. No lab on Thursday. No class on Tuesday or Thursday next week NCBI training Monday and Tuesday Feb. 5 during class time - questions and answers period. There will be a lab on Feb.5. Powerpoint lectures will be posted on website.

Gene expression and DNA microarrays
E N D
Presentation Transcript
Gene expression and DNA microarrays • No lab on Thursday. • No class on Tuesday or Thursday next week • NCBI training Monday and Tuesday • Feb. 5 during class time - questions and answers period. • There will be a lab on Feb.5. • Powerpoint lectures will be posted on website. • Reading assignment - two handouts • Chapter 3 has information regarding arrays
Genome of the week • E. coli O157:H7. • Causes haemorrhagic colitis • Initially identified in 1982 during an outbreak of severe bloody diarrhea. • Linked to contaminated ground beef from Michigan • 75,000 cases per year
Two different strains sequenced - link is to the U.S. sequence. • Major findings: • Comparison of E. coli O157:H7 with E. coli K-12 (common lab strain) found that the O157:H7 genome is ~ 1Mb larger than K-12 and contains 1,387 genes specific for O157:H7. • Genomes share a 4.1 Mb backbone with species specific DNA interspersed throughout the genome • K-islands - specific to K-12 (0.53Mb) • O-islands - specific • Lateral transfer of DNA occurs much more frequently than previously thought. Especially high for enterobacteria. • O-island specific DNA encoded genes required for virulence and a large number of phage and phage associated genes.
Gene expression • What is gene expression? • Methods for measuring a single gene. • Northern Blots • Reporter genes • Quantitative RT-PCR • Operons, regulons, and stimulons. • DNA microarrays. • Expression profiling • Identifying protein binding sites. • Comparing gene content of different strains.
What is gene expression? • The amount of RNA produced from a gene. • Level of RNA produced from a gene is controlled by: • Transcription • Degradation • Transcriptome - Expressed transcripts in a cell under defined experimental conditions. • mRNA(5-10% of total RNA). • rRNA, tRNA - make up most of total RNA • scRNA (protein secretion), tmRNA (rescue stalled ribosomes).
Analysis of gene expression at the single gene level. • Northern Blots • Measure RNA levels by hybridization of a labeled probe to total RNA. • Reporter Genes • Use of an enzyme to measure the amount of transcription from a promoter. • Quantitative RT-PCR. • Brief review pages - 158-160.
Regulons and Stimulons • Operon - group of genes co-expressed on a single transcript. • One location of the genome • Regulon - genes that are regulated by a single transcription factor. • Genes and operons throughout the genome • Stimulon - collection of genes that are regulated in response to environmental changes. • Can be multiple regulons affected at once. • Regulatory network - alternative term for regulon.
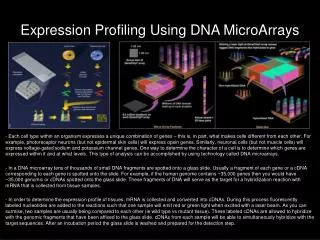
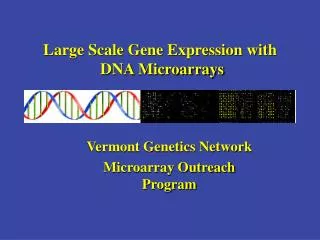
Assaying the regulation of 1000s of genes in a single experiment • DNA microarrays • DNA molecules printed at high density used to determine the level of RNA or DNA in a sample. • Can be thought of a “reverse Northern blots” • Other technologies (described in chapter 3). • SAGE • Microbeads
DNA Microarrays -Introduction • Spotted DNA arrays (glass slides) • Competitive binding of samples • Fluorescent detection - Cy3 and Cy5 • Small sample sizes (10-30µl). • PCR or cDNA arrays • Long oligonucleotide arrays • Better specificity, cheaper, easier to work with. • Short oligonucleotide arrays • ex. Affymetrix • DNA spotted onto nylon membranes (macroarrays)
Hybridization: basic concept The ability of two strands to hybridize is dependent on their complementarity. More complementarity=better hybridization
Labeling RNA or DNA with Cy3 or Cy5. • Cy3 and Cy5 - most often used fluorescent molecules used to label samples for microarray analysis. • Absorb light at one wavelength and emit at another. • Emission and Excitation spectra do not overlap significantly. • In arrays Cy3 and Cy5 are usually false colored green (Cy3) and red (Cy5) for ease of visualization.
More labeling • Direct incorporation - incorporates Cy3-or Cy5-dNTP directly into cDNA • RNA to cDNA - reverse transcriptase • DNA to DNA - DNA polymerase • Big problem - Cy3 and Cy5 are not incorporated with same efficiency. • Indirect incorporation - preferred method. • Incorporate an aminoallyl-dUTP molecule during reverse transcription of RNA to cDNA. • Chemically couple Cy3 or Cy5 dye after cDNA is made. • Coupling is efficient with both dyes.
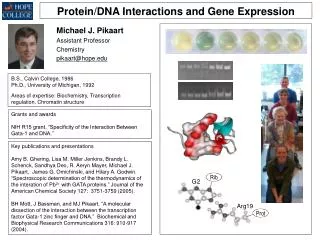
Applications of DNA microarrays • Expression profiling • Determining the relative levels of RNA in two or more samples. • DNA/DNA hybridizations • Investigate gene content between different strains • Determine gene dosage • 16S arrays - microbial communities (being developed). • Identification of protein binding sites • ChIP-Chip. Immunoprecipitation of protein/DNA complexes. Assaying those interactions with microarrays.
B. subtilis DNA microarrays • PCR generated microarrays using custom primers (Sigma-Genosys). • Each PCR product represents a single gene. • 4074 genes of 4101 on the array. • Printed on Corning CMT-GAPS slides. • 4 E. coli controls, each represented 15-20 times on the array.
How a DNA microarray works • Comparing the genome content of two B. subtilis strains. • The two strains differ only by the fact that JH642 is lysogenized with the bacteriophage SPb. • JH642 vs PY79 genomic DNA hybridization. • PY79 does not contain SPb. • SPb spots will be red.
JH642 PY79 Array size = 16mm x16mm Spot size = 150mM
SPb genes E. coli control JH642 PY79