Download
1 / 11
110 likes | 132 Vues
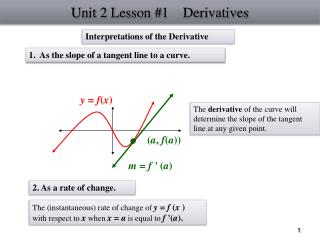
Learn how to sketch the graph of a function by analyzing its derivatives. Discover how to determine intervals of increase or decrease, find local maximum and minimum values, identify points of inflection, and understand concavity.

E N D
Derivatives and the shapes of graphs Increasing / Decreasing Test: • If f ′ (x) > 0 on an interval, then f is increasing on that interval. • If f ′ (x) < 0 on an interval, then f is decreasing on that interval. Example: Find where the function f (x) = x3 – 1.5x2 – 6x + 5 is increasing and where it is decreasing. Solution: f ′ (x) = 3x2 – 3x – 6 = 3(x + 1)(x - 2) f ′ (x) > 0 for x < -1 and x > 2 ; thus the function is increasing on (-, -1) and (2, ) . f ′ (x) < 0 for -1 <x < 2 ; thus the function is decreasing on (-1, 2) .
The First Derivative Test: Suppose that c is a critical number of a continuous function f. • If f ′ is changing from positive to negative atc, then f has a local maximum at c. • If f ′ is changing from negative to positive atc, then f has a local minimum at c. • If f ′ does not change sign atc, then f has no local maximum or minimum at c. Example(cont.): Find the local minimum and maximum values of the function f (x) = x3 – 1.5x2 – 6x + 5. Solution: f ′ (x) = 3x2 – 3x – 6 = 3(x + 1)(x - 2) f ′ is changing from positive to negative at -1 ; so f (-1) = 8.5 is a local maximum value ; f ′ is changing from negative to positive at 2; so f (2) = -5 is a local minimum value.
Concave upward and downward Definition: • Ifthe graph of f lies above all of its tangentson an interval, thenfis called concave upward on that interval. • Ifthe graph of f lies below all of its tangentson an interval, thenfis called concave downward on that interval. Concave upward Concave downward
Inflection Points Definition: A point P on a curvey = f(x) is called an inflection point iffis continuous there and the curve changes • from concave upward to concave downward or • from concave downward to concave upward at P. Inflection points
What doesf ′ ′say aboutf ? Concavity test: • If f ′ ′ (x) > 0 for all x of an interval, then the graph of f is concave upward on the interval. • If f ′ ′ (x) < 0 for all x of an interval, then the graph of f is concave downward on the interval. Example(cont.): Find the intervals of concavity of the function f (x) = x3 – 1.5x2 – 6x + 5. Solution: f ′ (x) = 3x2 – 3x – 6 f ′ ′ (x) = 6x - 3 f ′ ′ (x) > 0 for x > 0.5 ,thus it is concave upward on (0.5, ) . f ′ ′ (x) < 0 for x < 0.5 ,thus it is concave downward on (-, 0.5) . Thus, the graph has an inflection point at x = 0.5 .
Using f ′ ′to find local extrema The second derivative test: Suppose f is continuous near c. • If f ′ (c) = 0 andf ′ ′ (c) > 0 then f has a local minimum at c. • If f ′ (c) = 0 andf ′ ′ (c) < 0 then f has a local maximum at c. Example(cont.): Find the local extrema of the function f (x) = x3 – 1.5x2 – 6x + 5. Solution: f ′ (x) = 3x2 – 3x – 6 = 3(x + 1)(x - 2) , so f ′ (x) =0 at x=-1 and x=2 f ′ ′ (x) = 6x - 3 f ′ ′ (-1) = 6*(-1) – 3 = -9 < 0,so x = -1 is a local maximum f ′ ′ (2) = 6*2 – 3 = 9 > 0, so x = 2 is a local minimum
Summary of what y ′ andy ′ ′ say about the curve is positive is negative is zero is positive is negative is zero First derivative: Curve is rising. Curve is falling. Possible local maximum or minimum. Second derivative: Curve is concave up. Curve is concave down. Possible inflection point (where concavity changes).
Example(cont.): Sketch the curve of f (x) = x3 – 1.5x2 – 6x + 5. From previous slides, f ′ (x) > 0 for x < -1 and x > 2 ; thus the curve is increasing on (-, -1) and (2, ) . f ′ (x) < 0 for -1 <x < 2 ; thus the curve is decreasing on (-1, 2) . f ′ ′ (x) > 0 for x > 0.5 ;thus the curve is concave upward on (0.5, ) . f ′ ′ (x) < 0 for x < 0.5 ;thus the curve is concave downward on (-, 0.5) (-1, 8.5)is a local maximum; (2, -5)is a local minimum. (0.5, 1.75)is an inflection point. (-1, 8.5) (0.5, 1.75) -1 2 (2, - 5)
Curve Sketching Guidelines for sketching a curve: • Domain Determine D, the set of values of x for which f (x) is defined • Intercepts • The y-intercept is f(0) • To find the x-intercept, set y=0 and solve for x • Symmetry • If f (-x) = f (x) for all x in D, then f is an even function and the curve is symmetric about the y-axis • If f (-x) = - f (x) for all x in D, then f is an odd function and the curve is symmetric about the origin • Asymptotes • Horizontal asymptotes • Vertical asymptotes
Guidelines for sketching a curve (cont.): E. Intervals of Increase or Decrease • f is increasing where f ′ (x) > 0 • f is decreasing where f ′ (x) < 0 F. Local Maximum and Minimum Values • Find the critical numbers of f ( f′ (c)=0 or f′(c) doesn’t exist) • If f ′ is changing from positive to negative at a critical number c, then f (c) is a local maximum • If f′ is changing from negative to positive at a critical number c, then f (c) is a local minimum G. Concavity and Inflection Points • f is concave upward where f ′ ′ (x) > 0 • f is concave downward where f ′ ′ (x) < 0 • Inflection points occur where the direction of concavity changes H. Sketch the Curve