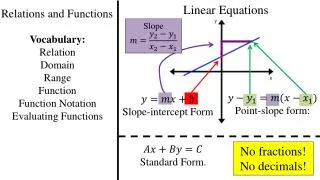
Relations and Functions
Relations and Functions. Lesson 2: Interpreting and Sketching Graphs. Todays Objectives. Describe a possible situation for a given graph Sketch a possible graph for a given situation Sort a set of graphs as functions and non-functions. Interpreting and Sketching Graphs.

Relations and Functions
E N D
Presentation Transcript
Relations and Functions Lesson 2: Interpreting and Sketching Graphs
Todays Objectives • Describe a possible situation for a given graph • Sketch a possible graph for a given situation • Sort a set of graphs as functions and non-functions
Interpreting and Sketching Graphs • There are many quantities encountered in real life that can be represented on a graph. In particular, we will look at cases where one variable is responding to, or is a function of, the other variable. • Consider the following graph, which illustrates height (h) in meters as a function of time for an elevator in a five-floor building. Assume that each floor is 4 m high.
Example Height of elevator as a function of Time Height (m) Time (s) At point A, the elevator is on the 3rd floor (the ground floor is at 0m). It then goes up at a steady speed to the 4th floor. It stays there for a few seconds, as shown from point B to C. The elevator then continues up to the 6th floor at a steady speed. It stays on the 6th floor for several seconds, as shown from D to E, before going back to the 1st floor at a steady speed without stopping.
*Use the absolute values to determine which slope is greatest Example • *An important thing to notice on the graph is the slope of the line segments. The greater the slope, the greater the rate of change. • In this case, the slope is a measure of the velocity of the elevator. (Greater rate of change)
Rate of change • Horizontal line segments occur when the value on the vertical axis is not changing. So, the flatter the line segment, the smaller the rate of change (elevator is not moving)
Example • The following graph shows the distance from Chiashome as a function of time during a walk that he took to the store and back home. • The distance from his home changes as he walks, so Chiasdistance from his home is a function of how long he has been walking (time).
Chiasdistance from home as a function of time Example Distance from home (m) Time (min) • Chia met Francis along the way and stopped to talk to him for a minute. Where is this on the graph? • What was happening from D to E? • Was Chia walking faster on the way to the store or on the way back?
Example • Guele is driving straight down main street in his Ferrari. When he starts, he is in a school zone. At the end of the school zone, Guele has to stop for a red light for a few seconds. He then drives again, but this time at a faster speed. He then reaches his destination after 4 minutes and stops and parks. • Draw a graph of Guele’s trip with distance travelled as a function of time. • *Time is ALWAYS plotted on the x-axis (independent variable)
Example Distance travelled as a function of time Distance travelled Time (min) Notice that the distance travelled does not have a scale as there was not enough information given.
Example • Lois and Caroline drove their Audi A8 to Pudong Airport to pick up their friend Bill. In the first hour, the car travels 65 km/h to the airport. The car then stops for 15 minutes as Lois and Carolinestop to buy chicken feet for a snack. The car then travels 65 km toward the airport. After 2 hours, the car has traveled 130 km and has reached the airport where it stops for 2 hours. The girls meet Bill and take 2 hours to travel 130 km back home. • Draw a graph for this situation.
Example Distance from home as a function of time Distance from home (km) Time (h)
Review Quiz • One line has a slope of 1/3, another line has a slope of -4/3. Which line has the greater slope? • The second line (4/3 > 1/3) • Which line represents the greater rate of change? • The second line • A horizontal line means a rate of change of zero. What would a vertical line mean? • Slope is undefined. For example, lets say Guele drives his Ferrari 30 km in 0 seconds. Is this possible?