Functions and Relations
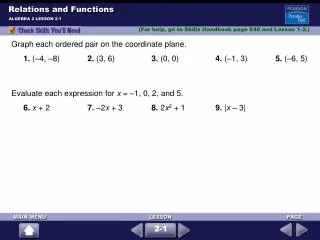
Functions and Relations. What is a relation?. A pairing of elements of one set with elements of a second set. Domain: is the set of potential values for the independent variable. Range: is the set of values for the dependent variable. . State the relation as a set of ordered pairs.

Functions and Relations
E N D
Presentation Transcript
What is a relation? • A pairing of elements of one set with elements of a second set. • Domain: is the set of potential values for the independent variable. • Range: is the set of values for the dependent variable.
State the relation as a set of ordered pairs. {(1.0,4.1), (4.9,17.5), (4.9,7.7), (11.5,31.4), (17.3,32.7)} {1.0, 4.9, 11.5, 17.3} Domain: Range: {4.1, 7.7, 17.5, 31.4, 32.7}
Besides a table or a set of ordered pairs what is another way we can represent the data?
What is a function? • A function is a relation in which each element of the domain is paired with exactly one element in the range.
Is the data we looked at in the previous example a function??? **Since the same domain value has two range values it is NOT a function!**
Looking at the graph how do we know it is not a function? Vertical Line Test: States that a graph is NOT a function if you can draw a vertical line any where on the graph and it passes through more than 1 point!! Does not pass the VERTICAL LINE TEST
List the points as a set of ordered pairs and use the vertical line test to determine if the relation is a function { (-3, 0), (-2, 2), (0, 3), (2, 2), (3, 0)} This is a function!
List the points as a set of ordered pairs and use the vertical line test to determine if the relation is a function { (-3, 3), (-2, 2), (-1, -1), (-1, 1), (1, 1) (1, -1), (2, 2), (3, 3)} This is NOT a function!
Using mapping diagrams to state the domain and range of a relation and determine if it is a function • Example 1. {(-3,0), (4,-2), (2,-6)} Steps: Create Domain and Range Boxes Place Domain and Range values in correct box Draw arrows connecting the points State if the relation is a function. Domain Range -3 4 2 0 -2 -6 Every input has 1 output so this is a Function!
Example 2 This is NOT a function since 4 has two outputs! 2. {(4,-2), (4,2), (9,-3), (-9,3)} 4 9 -9 -2 2 -3 3
Example 3 2. {(2,1), (6,0), (-5,-3), (-12,6), (-4, 0)} -12 -5 -4 2 6 -3 0 1 6 This is a function!
Using Set Builder notation to describe range and domain • Remember back to Unit 1! • Set builder notation looks like this… This says x such that x is …
Example Remember that the domain is all x values. That is all the values that go left and right. Since the graph goes on forever in either direction it will cover all of the x values. Remember that the range is all y values. That is all the values that go up and down. Since the graph does not go on the bottom half that means that y cannot be negative. Domain: Range:
This dotted line is called an asymptote. An asymptote is a line that the graph will approach but NEVER cross! Example Domain: Range:
Example Domain: Range:
Evaluating a function for a given value • In previous units you have solved problems that have asked you to evaluate an equation when x is equal to some number. • For example: • Solve 3x+2 when x = -3
Evaluating a function for a given value • In this unit, instead of saying evaluate for x= to some number we are going to use new notation. • For example: • Previously you would have seen: Solve 3x+2 when x = -3 • NOW you will see: Find f(-3) when f(x)=3x+2 This is only just New Notation! You solve these problems just as you did before.
Example 1 Solve the following: f(2) g(-3) f(-6) g(0)
Example 2: Combining equations f(3) + g(2) g(-2) – f(-2)
Evaluating a function by looking at a graph • Now we will see how a graph can give us the same information like the equation. (2, 8) Find f(2) Now lets find f(2) on the graph. What value did 2 substitute for in our equation? Lets find it on our graph
EXAMPLE Find the following values: f(-4) f(0) f(2) f(-2) f(3) f(1) 4 0 0 2 -1 1
Graphing functions on a restricted domain • Ex: Graph the function f(x) = 2x + 3 with the domain Steps: Make a table with the domain values. Solve for the y values Plot the points Connect the points
Graphing functions on a restricted domain • Ex: Graph the function f(x) = -x + 2 with the domain Steps: Make a table with the domain values. Solve for the y values Plot the points Connect the points
Graphing functions on a restricted domain • Ex: Graph the function f(x) = 3x - 4 with the domain Steps: Make a table with the domain values. Solve for the y values Plot the points Connect the points