Relations and Functions
Relations and Functions. Lesson 3: Graphs of Relations and Functions. Todays Objectives. Graph a set of data and determine the restrictions on the domain and range Explain why data points should or should not be connected on the graph for a situation

Relations and Functions
E N D
Presentation Transcript
Relations and Functions Lesson 3: Graphs of Relations and Functions
Todays Objectives • Graph a set of data and determine the restrictions on the domain and range • Explain why data points should or should not be connected on the graph for a situation • Determine, and express in a variety of ways, the domain and range of a graph, a set of ordered pairs or a table of values
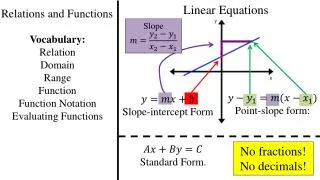
Domain and Range • Two of the important characteristics of a relation are the domain and range of the relation. • Domain: the set of all input (x-values), often represented by the variable “x”. • Range: the set of all output (y-values), often represented by the variable “y”. • On graphs, the domain is found along the x-axis, the range is found along the y-axis.
Domain and Range y Range x Domain
Domain and Range • Sometimes we can state the domain and range in the form of a list. Other times, it is impossible to list all of the values, so we use the less than or equal to ( ≤ ),less than (<), greater than or equal to ( ≥ ), greater than (>), and equal too (=) symbols. • A second way of showing these symbols is by using brackets (called interval notation) • Round brackets: ( and ) mean the same thing as > and < • Square brackets: [ and ] mean the same thing as ≥ and ≤ • Example: is the same as
Review of graphing symbols • In this lesson we will use a number of different graphing symbols • Line: Continues forever in both directions • Line Segment: Has two endpoints • Ray: Has one endpoint and continues forever in the other direction • Open dot: Means this value is not included in the domain/range • Closed dot: Means this value is included in the domain/range
Example D: x={1,2,3,4,5} R: y={1,2,3,4,5} In this example, there are few points on the graph, so listing the values in the domain and range is easy. Sometimes though, there are too many points to list them all.
Example Because this example is a line segment, the domain and range take on all values between the endpoints. So: Domain: The x-values start at 0 and increase until x = +6. This can be written as or [0,6] Range: The y-values also start at 0 and increase until y = +4. This can be written as or [0,4]
Example Domain: The x-values start at 0 and increase forever. This can be written as Range: The y-values start at 0 and increase forever. This can be written as
Example Domain: { Range:
Example: You do Domain: or Range: y = {0,1,2,3}
Example: You do Domain: { or [0,1), [2,3), [4,5) Range:
Example: You do Domain: (meaning x is an element of all the real numbers). Or in interval notation: , Range: y ≥ -3 or
Continuous and Discrete Data • There are two different kinds of data that can be drawn on a graph: continuous data and discrete data. • Discrete values are things that can be counted, and that cannot be divided into smaller pieces. For example, people! We can count the number of people in a room, and we cannot divide a person into two smaller people! • Continuous values include things that we measure and that can be divided into smaller pieces. For example: height. We can measure a persons height over time in meters. Meters can be divided into cm’s, then into mm’s, etc etc.
Discrete data • Discrete data cannot be divided up into smaller pieces, so we must graph discrete data using points that are not connected by lines. For example, if we are plotting number of people in a room over time, we cannot have any values between 4 and 5 people because we can’t have 0.5 of a person. So we would draw a point at 4 and a point at 5 with nothing in between.
Continuous data • Continuous data is plotted using points that are connected by a line because continuous data can take on all values. For example, if we were graphing depth of water over time of a swimming pool as we filled it, we could draw a line connecting all of our measured points. This is because for water to reach 5 feet depth, it must have passed all possible smaller depths to get there.
Practice! • Pg. 294-297 • #7-9, 12-14, 17, 19, 20, 24 • Have fun!
Wall Quiz • In teams of 3, move around the classroom and answer the questions posted on the walls • After the time runs out, return to your seats and we will compare answers • The team(s) with the most correct answers will win candy!