Download
1 / 24
240 likes | 628 Vues
DELAMINATION DETECTION OF HMA AIRPORT PAVEMENTS WITH NDT DEVICES. Manuel Celaya, MSCE, Soheil Nazarian, Ph.D., PE, Chetana Rao Ph.D., PE, and Harold Von Quintus, MSCE, PE. The University of Texas at El Paso, Texas. Introduction. Delamination in Hot Mix Asphalt

E N D
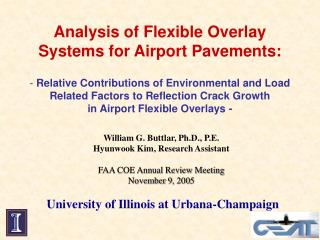
DELAMINATION DETECTION OF HMA AIRPORT PAVEMENTS WITH NDT DEVICES Manuel Celaya, MSCE, Soheil Nazarian, Ph.D., PE, Chetana Rao Ph.D., PE, and Harold Von Quintus, MSCE, PE The University of Texas at El Paso, Texas
Introduction • Delamination in Hot Mix Asphalt • Delamination in Airport Pavements • NDT Methods for Delamination Detection • Controlled Study • NDT Results • Conclusions and Recommendations
Delamination in Hot Mix Asphalt Bonding between pavement layers is essential. Poor bond usually manifests as slippage cracking. Poor bond may develop into delamination or debonding, reducing serviceability and performance. If delamination goes undetected, it can result in the peeling away of thin overlays from the surface. Slippage
Delamination in Airport Pavements Delamination is more severe on airfield pavements, due to higher traffic loads (aircrafts). Situation is critical where airplanes brake and turn, or on areas under large horizontal load (slippage) . May develop into foreign object debris (FOD), leading to runway closures. Slippage in Airports FOD in Airports
NDT Methods for Delamination Detection • Ground-coupled Penetrating Radar (GPR) • Impulse Response (IR)Portable Seismic • Pavement Analyzer (PSPA) • Thermography (Infrared Camera) • Six other less successful alternatives
Ground Penetrating Radar (GPR) Based on transmission of electromagnetic waves. Reflections of these waves at interfaces used to determine thickness/depth, and to determine some properties of material. Surface Reflection Asphalt Layering Ground-coupled (GPR) Typical GPR Scan
Portable Seismic Pavement Analyzer (PSPA) High-frequency pulses are generated by source and propagate through material Modulus of top layer is calculated without an inversion algorithm (USW Method). Dispersion Curve (variation of velocity /modulus vs. wavelength/depth) is obtained using signal processing. Sensor 2 Range Used for average Modulus Measured Source Sensor 1 Dispersion Curve Time Records
Impulse Response (IR) An impulsive load is applied to pavement surface with an instrumented hammer. Vertical deformation of pavement is measured with a geophone. Ratio between load cell and geophone amplitudes or the frequency responses using a Fast-Fourier Transform (FFT) is calculated. Time Records Frequency Response
Thermography: Infrared Camera Infrared Thermography measures temperature distributions across the surface of the pavement. Used to detect the presence of shallow subsurface flaws in HMA. Infrared Image
Controlled Study 11 Different Sections constructed. Two mixes: Fine (P-401) and Coarse (P-403) Three levels of bonding between HMA: bonded, partially-bonded and debonded. In addition, severe debonding was reproduced. Two depths of debonding: shallow (2.5 in.) and deep (5 in.). Different extents of delamination.
Controlled Study Selection of debonding agents based on laboratory tests (direct shear). Each Section was 10x9 ft. Delaminations of 4x9, 2x2, 1x1 and 0.5x0.5 ft were placed. Typical Section Layout Debonding Agents Used
Test Setup A grid of 5x5 points was selected for PSPA, IR and Infrared. 5 Lines were evaluated with GPR.
GPR Results Intact Severe Debonded
GPR Results GPR detected the severely debonded area within the transition zone and some debonded areas primarily on talcum powder or clay perhaps because of the significant contrasts in their dielectric constants and HMA. GPR may be most suitable when the debonding is in severe stages or when moisture is present along the interface.
PSPA Results Time Records Dispersion Curves Intact Severe Debonded
PSPA Results. Dispersion Curves Reductions in modulus can be observed in most sections below depths of prepared debonding. This demonstrates that the USW method might be able to identify delaminated areas reasonably well, especially the shallow ones.
PSPA Results. Overall Coarse Mix (P-403) Fine Mix (P-401) Average and standard deviation of control sections (1 and 6) used as reference
IR Results Time Records Frequency Response The ratio (load/displacement) of the maximum values of the FFT amplitudes (stiffness) used to compare the results
IR Results. Temperature Influence Coarse Mix (P-403) Fine Mix (P-401) Temperature at the time of testing affects the outcome of this method
IR Results. Overall Average and standard deviation of control sections (1 and 6) used as reference
Infrared Results Only severely debonded area within transition zone was clearly detected Passive source (sunlight) used to create the temperature differentials
Conclusions and Recommendations • GPR (best for severe debonding with moisture) • detected 33% of debonded areas, primarily on talcum powder or clay. • Impulse Response (best for fully debonded, especially deep) • detected 59% of debonded areas with majority of defects detected on fully-debonded areas (shallow and deep). • Ultrasonic Surface Waves (best for shallow partial or full debonding) • The USW method as implemented in the PSPA detected 53% of debonded areas. • Thermography was not as successful as reported in the literature. • FWD detected 46% of debonded areas, best during cold weather testing. • The IR, FWD and USW methods require temperature adjustments. • IR and FWD temperature adjustment is site dependent and should be considered in the field protocol.
Monte Symons • Rodney Joel • Kathleen T. Hall • Gary Harvey • Luis Rodriquez • PDX • BOS Acknowledgments The University of Texas at El Paso, Texas