Download
1 / 39
390 likes | 589 Vues
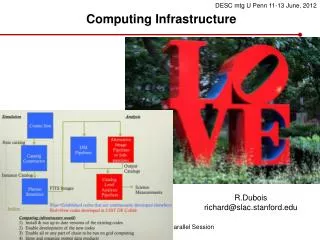
Monitoring and Controlling a Scientific Computing Infrastructure. Jason Banfelder Vanessa Borcherding Dr. Luis Gracia Weill Cornell Medical College. Overview. Overview of operations Scientific research Computational infrastructure Building a monitoring framework with IT Monitor and PI

E N D
Monitoring and Controlling a Scientific Computing Infrastructure Jason BanfelderVanessa BorcherdingDr. Luis Gracia Weill Cornell Medical College
Overview • Overview of operations • Scientific research • Computational infrastructure • Building a monitoring framework with IT Monitor and PI • Conserving power used by compute clusters • Future challenges
Scientific Research • Develop, integrate and maintain computational and other technological resources to support… • Dept. of Physiology and Biophysics • Institute for Computational Biomedicine • Computational Genomics Core Facility …at the Weill Medical College of Cornell University • Research, educational, and clinical mission • Roughly 75 people to support
High Performance Computing • Simulations of biological systems • Molecules, tissues, cells, organs • Analysis of large datasets • Genomes, other -omes • High-throughput experiments • Corpus of biological literature • Imaging & Viz (MRI, confocal microscopy, ...) • Clinical and basic science • Immersive visualization (CAVE Q4’07) • Other services • Desktop, print, videoconference
Desktop Environment • Not possible or desirable to standardize • Operating System Distribution • 60% Windows XP • 35% Mac OS X* • 5% Linux (RedHat, Debian) • Need to support all of them
Compute Resources • 750+ processors; 2+ Tflop/sec • 208 node/416 processor Linux cluster • 90 node/186 processor Linux cluster* • 24 processor IBM pSeries (48G memory) • 16 processor SGI Altix • Fairly heterogeneous environment • Primarily Dell/Intel (~95%); some IBM, SGI • Primarily Linux (Red Hat); some AIX, IRIX
Storage Resources • Mainline storage and cluster storage • 40+ TB raw spinning disk • 14 RAID arrays • Apple FibreChannel (Brocade and QLogic switches) • Dell SCSI direct attach • Some SGI • Server Backup is LTO3 tape based • Two libraries (robots) • Four drives • Desktop backup is disk based • Retrospect
Application Resources • Scientific Software Library • 100+ programs/versions • Open Source and Commercial • LAMP+ stack • Redundant Apache servers • Web app server (Tomcat/Java) • Oracle 10g Enterprise
Physical Plant • Three Server Rooms • Cornell University Ithaca Campus • 208 node cluster was too power/HVAC intensive to house on NYC campus • Fully equipped for remote management • Lights out facility, one visit last year • NYC Campus • 125 kVA server room (10 cabinets) [12.5 kW/cabinet] • 300 kVA server room (12 cabinets) [25 kW/cabinet!!!] • At full load, we can draw over 1 MW to run and cool!
Managing the Infrastructure • All of the above built and maintained by a group of three people. • Automation required • Don’t want to standardize too much, so we need to be very flexible
Why IT Monitor and PI? • IT Monitor / PI selected to be the central repository for health and performance monitoring (and control). • Able to talk to a diverse set of devices • Printers, servers, desktops • Network switches • Building management systems • …pretty much anything we care about • Pick and choose the parts you want to use, you build the solution • Ping, SNMP, HTMP interfaces, ODBC • Very strong, proven analytics • Vendor specific solutions are (expensive) islands
Overall Systems Health • Want a quick, holistic view of our key resources • Core infrastructure • File servers, web servers, app servers • Backup servers • Cluster utilization • Node statuses and summary • Physical plant • Temperature monitoring
Data is Available to Everyone • Adobe Flash/Flex used for display
Why IT Monitor / PI? (revisited) Is this affected by that? • This can only be answered if all your data is in the same place.
Network Layout • PI Server can only see head node • OK; head node knows what’s going on anyway • How does PI Server read the data we are interested in? • Node statuses and summary statistics
Project 2: Cluster Power Management • Green computing… • Save power (and $$$) by shutting down nodes that are not in use. • …but minimize impact on performance • Maintain a target number of stand-by nodes ready to run new jobs immediately. • Reduce latency perceived by end-users
The Cost of Power and Cooling Lawton, IEEE Computer, Feb 2007
Powering HPC • Density is increasing • 20+ kW per cabinet (standard designs were 2-4 kW only a few years ago) • Localized heat removal is a problem • HVAC failures leave very little time for response • Load is highly variable • Harder to control
Our Cluster • 90 compute nodes • 3 ‘fat’ nodes; 2 ‘debug’ node • 85 nodes under CPM • Power used: • In Use node: 250 W • Stand-by node: 125 W • Power Save nodes: 0 W • With 50% usage and no standby nodes: power savings is 32% • With 66% usage and 16 standby nodes: power savings is 11%
Historical Cluster Usage Full nodes Partial nodes Number of Nodes
Hardware Requirements • Hardware Requirements • Chassis Power Status • Remote Power Up • PXE is a plus for any large system • Dell Servers do all of this standard (and much more!) • Baseboard Management Controller • Dell Remote Access Card
IPMI + IT Monitor = Data + Control [root@cluster clusterfi]# ipmitool -I lan -H 10.1.12.190 -U root -f passfile sensor list Temp | 21.000 | degrees C | ok | 120.0 | 125.0 | na Temp | 20.000 | degrees C | ok | 120.0 | 125.0 | na Temp | 23.000 | degrees C | ok | 120.0 | 125.0 | na Temp | 23.000 | degrees C | ok | 120.0 | 125.0 | na Temp | 40.000 | degrees C | ok | na | na | na Temp | 61.000 | degrees C | ok | na | na | na Ambient Temp | 16.000 | degrees C | ok | 5.000 | 10.0 | 49.0 | 54.0 Planar Temp | 20.000 | degrees C | ok | 5.000 | 10.0 | 69.0 | 74.0 CMOS Battery | 3.019 | Volts | ok | 2.245 | na | na | na
Lifecycle of a Compute Node • CPM uses a finite state machine model • Tunable parameters • Target number of standby nodes • Global time delay for shutdowns • Prevent churn of nodes
Lifecycle of a Compute Node • IU: In Use • SB: Standing by • PSP, PD, QR: Shutting down • PS: Power Save • PUP: Powering Up • BAD: Problems • UK: Unknown • UM: Unmanaged
Cluster Power Management In Action Note correlation between temperature and cluster usage Powered down
Results: Six Months of CPM • Six Month Average: • 13.6 nodes shut down for power savings. • 16% of managed nodes • 8% power savings • 15.06 MW*h annual savings • $3,000 annual power savings ($0.20/kW*h) • Probably double when considering HVAC • Equipment life
Future Ideas/Challenges • Tunable parameters • Function of time of day, day of week? • Based on past observations? • Balance runtime of nodes • Balance heat distribution in data center • Synchronize with HVAC rotation schedule and failures
Future Ideas/Challenges • Integration with building systems • Detecting nascent problems is critical • Very fast temperature rises • Integration with power companies • IT is being targeted as an ‘easy’ load to manage in an emergency • Variable power costs (over time, across locations)
Thank You Q & A Jason Banfelder jrb2004@med.cornell.edu