Real-time Infrastructure Monitoring Application Case Study
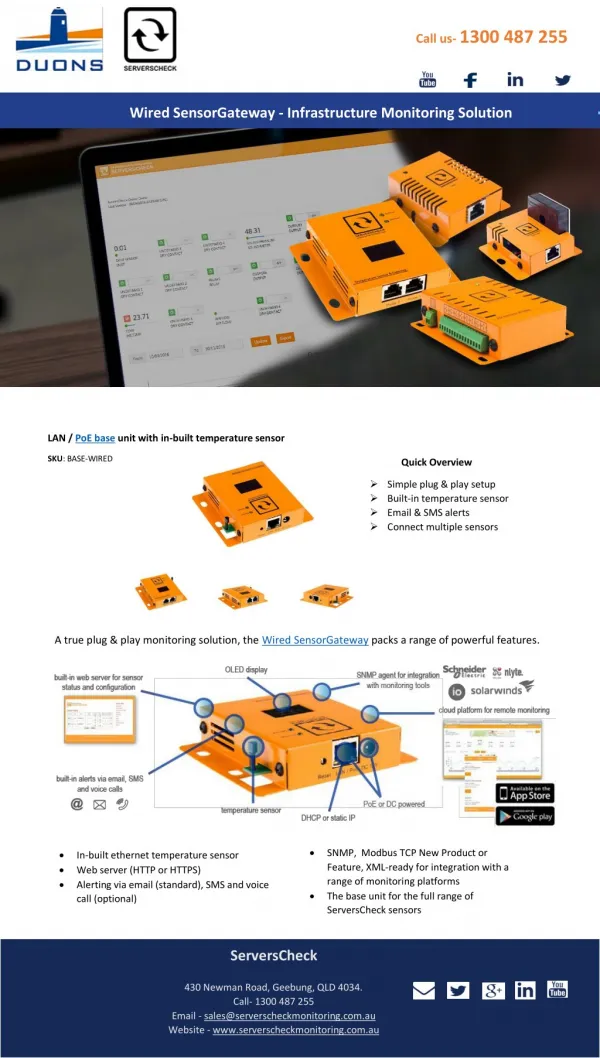
Explore a case study of a graphical monitoring application accessed through a web browser, utilizing datalog analysis and Flot - a JavaScript plotting library for jQuery. Monitor diverse technologies with over 1000 signals including PLC, Modbus, SSH, and more. Enhance your control and tracking capabilities by remotely managing converters and analyzing data logs in real time. This advanced system provides secure data transmission, flexible configurations, and robust connection recovery mechanisms.

Real-time Infrastructure Monitoring Application Case Study
E N D
Presentation Transcript
Monitoring infrastructure A case study
flot – javascript plotting library for jQuery • Select up-to 8 variables fro plotting • Select variables to be logged in a RD • Scanning period – multiples of 5 seconds
Technology monitoring schema 496 binary signals 500 analog signals 16 bits Up to 500 integer signals 16 bits PLC PLC PLC Modbus RTU (slave) 19920 bits/sec 1 start bit, 8 data bits, 1parity bit (even), 1 stop bit RS-485 bus unitId=2 unitId=3 unitId=1 UNIX (uUnix) SSH client/server Modbus master SSL client/server Programmableconvertor(freescale microprocessor) Ethernet, TCP/IP
Monitoring technology • PLC • Programmable Modbus RTU / Ethernet convertor
The convertor inside SSH client Modbus RTU master Modbus TCP slave SSH server RS-485 Ethernet DHCP client Serial port TCP/IP interface SSL client NTP client SSL server
Problem definition I Convertor Web browser Convertor ??? On-line monitoring Convertor Web browser Data log analysis cca 1800 pieces Web browser Convertor Diagnostics
Problem definition II • The convertor must not require a fixed IP address • The data transmission must be secured (e.g. a SSL tunnel) • Data is logged in parallel with monitoring • Obsolete data is deleted (history depth is configurable) • Connection recovery (e.g. forced convertor reboot to recover the correct functionality) • Remote firmware upgrade/downgrade • Remote convertor re-configuration • => convertor controlled through kind of control channel? • Possible extension to another protocol than Modbus