Download
1 / 19
200 likes | 388 Vues
Agile Infrastructure Monitoring. HEPiX Spring 2013 17 th April 2013 Pedro Andrade – CERN IT/CF. Context. Monitoring in IT covers a wide range of resources Hardware, OS, services, applications, files, jobs, etc. Resources have several dependencies between them

E N D
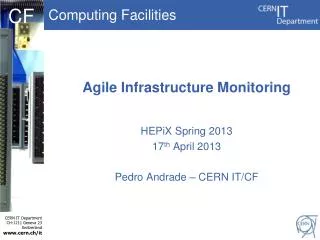
Agile Infrastructure Monitoring HEPiX Spring 2013 17th April 2013 Pedro Andrade – CERN IT/CF
Context • Monitoring in IT covers a wide range of resources • Hardware, OS, services, applications, files, jobs, etc. • Resources have several dependencies between them • Many application-specific solutions at CERN IT • Similarneeds and architecture • Publish metric results, aggregate results, alarms, etc. • Different technologies and tool-chains • Some based on commercial solutions • Similar limitations and problems • Limited sharing of monitoring data AI Monitoring - 2
Context • Several improvements and challenges to address • Make monitoring data easy to access • Combine and correlate monitoring data • Better understand infrastructure/services performance • Quick and easy deployment/configuration of dashboards • Move to a virtualized and dynamic infrastructure • Optimize effort allocated to monitoring tasks • Need to define a common monitoring strategy! AI Monitoring - 3
Strategy and Architecture • Architecture based on a toolchainapproach • All components can be easily replaced • Adopt whenever possible existing technologies • mongoDB, logstash, hadoop, kibana, etc. • Scalability always taken in consideration • Horizontally scaling or by adding additional layers • Messaginginfrastructure as key transport layer • Messages based on a common format (JSON) • Messages based on a minimal specification AI Monitoring - 4
Strategy and Architecture Storage and Analysis Dashboards and APIs App X Tools for Operations Notifications Consumer Metrics Consumer Metrics Consumer App Specific Consumer Monitoring of Monitoring Aggregation Producer Producer Producer Integrated Solutions … Components provided as SaaS and/or PaaS ! AI Monitoring - 5
Tools for Operations • Scope • Real-time delivery of notifications • Targeted to appropriate sys admin or service manager • Model • Several producers of notifications publishing to messaging • Central gateway for creation of tickets • Dashboard for visualization of current notifications • Central instance for all notifications • Service specific instances for selected notifications AI Monitoring - 6
Tools for Operations • Technologies • General Notification Infrastructure (GNI) • MongoDB, ActiveMQ, DBoD, Django GNI Dashboard Service Now Snow Consumer Dashboard Consumer No Contact Processor ActiveMQ Aggregation Processor Lemon Producer Scom Producer Metrics Manager AI Monitoring - 7
Tools for Operations AI Monitoring - 8
Storage and Analytics • Scope • Store all monitoring data in a common location • Allow complex data analytics (cross data sets) • Correlate information from distinct data sources • Import and store resources metadata (HW, SW, etc.) • Archival of monitoring results • Recovery of monitoring records • Promote sharing of monitoring data and analysis tools • Feed the system with processed monitoring data AI Monitoring - 9
Storage and Analytics • Model • Several producers of metrics publishing to messaging • Central service collecting all monitoring data • Analytics tasks per applications and IT-wide • Technologies • NoSQL are the most suitable solutions • Map-reduce paradigm is a good match • Based on IT Hadoop service (CDH) AI Monitoring - 10
Dashboards and APIs • Scope • Provide powerful easy to use/deploy dashboards • Provide reliable APIs for programmatic access • Global views and service-specific views • Model • Several producers of metrics publishing to messaging • Central service with high-level dashboards (e.g. SLS) • Specific dashboard instances per service/host/metric/etc. • Technologies • Tests with Splunk and Logstash+Elasticsearch+Kibana AI Monitoring - 11
Dashboards and APIs AI Monitoring - 12
Monitoring of Monitoring • Scope • Provide reliable monitoring of monitoring tools • Using as much as possible same tools • But avoid using same monitoring instances • Technologies (for GNI only) Logstash Elastic Search Kibana Redis … Logstash Logstash Email AI Monitoring - 13
Examples • Monitoring of linux nodes • Producers: • Based on existing Lemon agents and sensors • Lemon producer forwarding data to messaging • Consumers: • Notifications handled by GNI consumers GNI Dashboard GNI ServiceNow Puppet Nodes Quattor Nodes LAS Lemon Web AI Monitoring - 14
Examples • Monitoring of windows nodes • Producers: • Based on SCOM (system centre operations manager) • SCOM integrates data from all windows nodes • Consumers: • Notifications handled by GNI consumers GNI Dashboard SCOM GNI Windows Nodes ServiceNow AI Monitoring - 15
Examples • Monitoring of Castor service • Good example of architecture adoption by one service • More details in Massimo’s talk (tomorrow PM) • Producers • Castor producer sending castor logs to messaging • Consumers • Metrics stored in Hadoop for archive and analytics • Other castor specific tools: MAE, Cockpit, LogViewer • But also interesting for other services! AI Monitoring - 16
Future Plans • Get more data… more producers • Number of hosts monitored by new lemon producer • Number of producers from new applications • Test and improve monitoring operational tools • Improve operational procedures • Get feedback from sys admin and service managers • Test monitoring of Wigner resources • Continue implementation of analytics tools • Data in Hadoop to allow users to run analytics tasks • Provide and test configurable dashboards instances AI Monitoring - 17
Summary New monitoring strategy and architecture defined Preproduction system for notifications in place Implementation ongoing for monitoring data analytics and dashboards AI Monitoring - 18
Thank you! Thank the contribution of all members of CERN IT Agile Monitoring Team to this work ! http://cern.ch/aimon ai-monitoring-team@cern.ch