Download
1 / 24
240 likes | 372 Vues
Charlotte South Corridor LRT. Bill Woodford AECOM. March 2009. FTA Workshop on Travel Forecasting for New Starts. 1. Charlotte South Corridor LRT The Big Picture. Important markets / modeling approach Traditional walk-access market / traditional model calibrated to existing bus system

E N D
Charlotte South Corridor LRT Bill Woodford AECOM March 2009 FTA Workshop on Travel Forecasting for New Starts FTA Workshop on Travel Forecasting for New Starts 1
Charlotte South Corridor LRTThe Big Picture • Important markets / modeling approach • Traditional walk-access market / traditional model calibrated to existing bus system • New park-ride access market / park-ride nests and constants imported from Houston Park-and-Ride model • Special event ridership / off-model procedures based on event data • What was forecasted to happen in opening year: • Walk access: 4,400 trips/day • Drive access: 3,100 trips/day • Special events: 1,700 trips/day • Total: 9,200 trips/day • What actually happened: • Walk access: 10,800 trips/day • Drive access: 4,000 trips/day • Special events: Very significant • Total: 14,800 trips/day • Conclusion: LRT attracted more choice-based walk-access (and feeder bus) trips than forecasted FTA Workshop on Travel Forecasting for New Starts
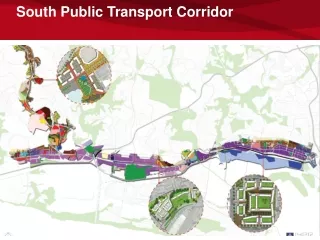
Charlotte South Corridor LRTThe Project • New 9.6 mile light rail line along South Boulevard serving: • Uptown Charlotte (CBD) • 4 stations • Walk egress / bus transfer • Southend • 4 stations • Walk access / bus transfer • Inner PNR Stations • 6 stations • PNR / walk access / bus transfer • I-485 PNR • PNR / walk access / bus transfer FTA Workshop on Travel Forecasting for New Starts
Charlotte South Corridor LRT Before FTA Workshop on Travel Forecasting for New Starts
Charlotte South CorridorForecasting Model • Four step model calibrated to 1999/2000 on-board survey • Separate nests for walk and drive access for • Local Bus • Express Bus • Premium (LRT) • Calibrated to match existing CATS bus volumes • Premium Park-and-Ride – to – CBD constants: • Based on Houston model (Bus PNR) • Largely eliminated calibrated negative constants for PNR • LRT forecasts compared to aggregate model (developed by Phoenix MPO) to confirm reasonableness FTA Workshop on Travel Forecasting for New Starts
Charlotte South Corridor LRT1999-2000 Transit Markets • 60% Home-Based Work purpose • 65% Attracted to non-CBD locations • CBD: Even income distribution, more work trips, more drive access • Non-CBD: Lower income distribution, more non-work, few drive access FTA Workshop on Travel Forecasting for New Starts
Charlotte South Corridor LRTOpening Day Forecast FTA Workshop on Travel Forecasting for New Starts
Charlotte South Corridor LRT2007 CATS System “Before” Survey FTA Workshop on Travel Forecasting for New Starts
Charlotte South Corridor LRT2007 CATS System “Before” Survey Characteristics of transit market: • Evenly split between work and non-work purposes • 75% of customers travel to attractions outside CBD FTA Workshop on Travel Forecasting for New Starts
Charlotte South Corridor LRT2007 CATS System Before Survey • 50% Home-Based Work purpose • Peak travel to CBD: Higher income distribution, more work trips, more drive access • Other travel: Lower income distribution, more non-work, few drive access FTA Workshop on Travel Forecasting for New Starts
Charlotte South Corridor LRT After FTA Workshop on Travel Forecasting for New Starts
Charlotte South Corridor LRTImplementation Progress • South Corridor LRT opened 11/2007 • LRT and bus operations generally implemented as modeled • Average weekday ridership April 2008 of 14,800 per day (16,500 in June 2008) • Strong PNR market at southern stations • Strong special event and non-work markets FTA Workshop on Travel Forecasting for New Starts
Charlotte South Corridor LRTInterim Before/After Analysis • Goal: Understand project success and update model to reflect current bus and LRT market acceptance • Approach: Collect data on LRT usage, incorporate LRT and “before” bus survey into model, and test procedures for capturing customer response to LRT FTA Workshop on Travel Forecasting for New Starts
Charlotte South Corridor LRTApril 2008 Rail Intercept Survey • Intercept interview survey conducted on April 29th, 30th 2008 between 3:30 PM and 6:30 PM • Survey conducted for southbound trains • Conducted at 7th Street, CTC, and 3rd Street stations • 903 usable survey records FTA Workshop on Travel Forecasting for New Starts
Charlotte South Corridor LRTApril 2008 Rail Intercept Survey FTA Workshop on Travel Forecasting for New Starts
Charlotte South Corridor LRTIntercept Survey Results Key findings (2008 LRT as compared to 2007 System survey): • Much higher non-work trip making to CBD • One LRT line attracts more off-peak CBD trips than entire bus system (and nearly as many peak CBD trips) FTA Workshop on Travel Forecasting for New Starts
Charlotte South Corridor LRTPeak HBW Trips to CBD Key findings • LRT customers have higher average incomes • LRT customers more likely to PNR FTA Workshop on Travel Forecasting for New Starts
Charlotte South Corridor LRTLRT Forecasts Based on Before-Survey Model Calibration • Model previously scrubbed for trip table and travel time skim problems – generally replicates observed ridership patterns but with large negative transit constants • Calibrated model underestimates ridership across the board by 50% or more without inclusion of special guideway effects • Very heavy LRT preference factors/constants required to match observed ridership FTA Workshop on Travel Forecasting for New Starts
Charlotte South Corridor LRTLRT Forecasts Based on Before-Survey Model Calibration • Large constants appear to attract too many short trips and too few long PNR trips at Sharon West and South I-485 FTA Workshop on Travel Forecasting for New Starts
Charlotte South Corridor LRTAlternate “Choice Set” Approach • The conventional approach requires implausibly large constants • Alternative hypothesis: LRT has increased population of travelers who consider transit to be an option • Awareness of transit • Social acceptability • Other • Approach: • Feed mode choice model with person trip containing only those trips where travelers are willing to choose transit • Test Implementation: • Limit rail guideway effects to 30% time discount + 12 minutes • Limit transit income constants to gradual decline in high income travelers willingness to ride transit • Find proportion of trip table willing to consider transit to match pre- and post-rail ridership results FTA Workshop on Travel Forecasting for New Starts
Charlotte South Corridor LRTLimited Income Constants FTA Workshop on Travel Forecasting for New Starts
Charlotte South Corridor LRTCalibrated Fraction of Trips Considering Bus Transit Note: Calibrated Fraction of Trips Considering Rail=100% for all cells FTA Workshop on Travel Forecasting for New Starts
Charlotte South Corridor LRTModeled Station Volumes for Alternative Methods • Choice set approach also improves model performance for short trips and long PNR trips (at South I-485) FTA Workshop on Travel Forecasting for New Starts
Charlotte South Corridor LRTConclusions • Introduction of LRT had impact on selected markets not fully explained by time and cost changes • Alternative approaches for capturing fixed guideway preferences may yield better forecasts and a more plausible explanation than mode specific constants • TCRP H-37 will research values of unmeasured attributes in fixed guideway transit including possible impacts on choice sets FTA Workshop on Travel Forecasting for New Starts