Download

1 / 38
380 likes | 573 Vues
Damage Assessment of Hurricane Katrina Using Remote Sensing Technique. Jae Sung Kim and Jie Shan Geomatics Engineering, School of Civil Engineering Purdue University ASPRS Conference, Tampa, FL May 10, 2007. Outline . Background information Data used Classification methods Results

E N D
Damage Assessment of Hurricane Katrina Using Remote Sensing Technique Jae Sung Kim and Jie Shan Geomatics Engineering, School of Civil Engineering Purdue University ASPRS Conference, Tampa, FL May 10, 2007 ASPRS Tampa Conference, May 10, 2007
Outline • Background information • Data used • Classification methods • Results • Concluding remarks ASPRS Tampa Conference, May 10, 2007
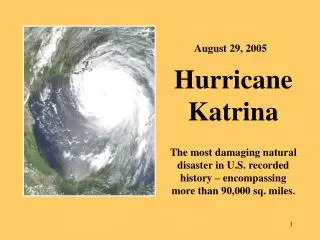
Facts about Katrina and New Orleans • Landfall date: Aug.29, 2005 • Landfall site: Plaquemines Parish, LA • Category 3 on the Saffir-Simpson scale when landed (windspeed 140 mph, central pressure 920 mb) • Damaged States: Louisiana, Mississippi, Florida, Alabama (Federally declared disaster states by FEMA) • Economic damage: more than $100 billion (Estimated by Risk Management Solutions, CA) • Mean elevation is below the sea level. • The collapse of the levee system caused submergence • Urban damages: Building, Road, Tree, Grass, Bareland • The objective of this study is to • Estimate the damage to urban features • Study the best technique for such estimation ASPRS Tampa Conference, May 10, 2007
Methodology ASPRS Tampa Conference, May 10, 2007
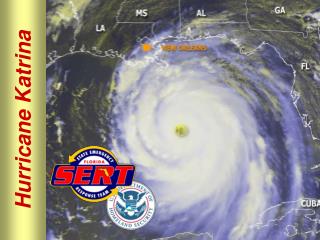
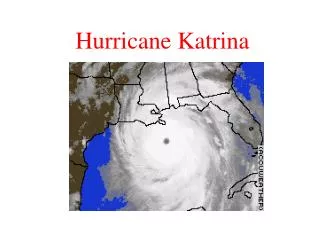
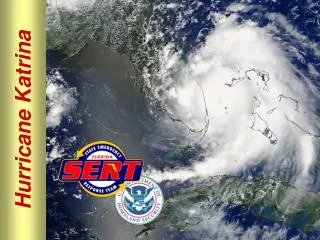
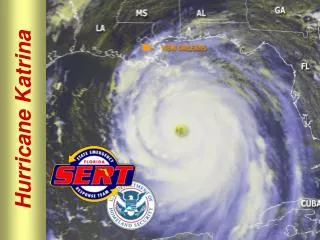
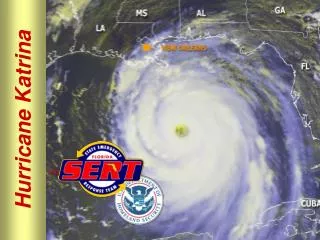
Hurricane Katrina Image NOAA Satellite image (Aug.29.2005) <http://www.srh.noaa.gov/hgx/gifs/Katrina.jpg> ASPRS Tampa Conference, May 10, 2007
Submergence Area Estimation at State Level Input data: Landsat 7, 5 images http://eros.usgs.gov/katrina/products.html> ASPRS Tampa Conference, May 10, 2007
Method for submerge estimation • The input images of before & after Katrina were segmented by gray levels (ArcIGIS), w/ green band only MIR • Water class of pre- Katrina was clipped out from post-Katrina class • The total submerged area was estimated to 511 km2 – the total land area ??????? ASPRS Tampa Conference, May 10, 2007
Submergence Area at State Level ASPRS Tampa Conference, May 10, 2007
Estimated by DEM and water level data of USGS West -End stream flow gage site ASPRS Tampa Conference, May 10, 2007
Damage Assessment in New Orleans Quickbird images (March ‘04 & Sep. 03 ‘05); GSD: 2.45m ASPRS Tampa Conference, May 10, 2007
Damage Assessment - classification • Supervised classification – bands info etc • Training • Trainingsample areas are selected for each class • 100+ sample areas of different building roofs • Non parametric rule: feature space • Parametric rule: maximum likelihood for unclassified & overlap rule ASPRS Tampa Conference, May 10, 2007
Damage Assessment – classification Pre Katrina, Overall Accuracy: 84.29 %, Kappa Statistics: 0.8056) Post Katrina. Overall Accuracy: 83.82%, Kappa Statistics: 0.8003) ASPRS Tampa Conference, May 10, 2007
Damage Assessment – Numerical comparison ASPRS Tampa Conference, May 10, 2007
Damage Assessment • Most roads (~60%) were submerged • The submerged building cells are low level structures e.g, single story building or lower building edge • Most of low elevation classes such as road, grass, tree, and bare land are submerged by 56-73%. • Submergence is more severe at northern New Orleans ASPRS Tampa Conference, May 10, 2007
Damage Assessment • Input data : Ikonos images (Aug ‘02 & Sep.02 ’05, Space Imaging, GSD: 1m ASPRS Tampa Conference, May 10, 2007
Assessment of Damage ASPRS Tampa Conference, May 10, 2007
Damage Assessment • Bare lands are completely disappeared • Most grasses are submerged. • The amount of water increased more than 2.8km2 and this area is severely submerged. ASPRS Tampa Conference, May 10, 2007
Damage Assessment • Classification Accuracy (Before Katrina) Overall Classification Accuracy = 65.81% Overall Kappa Statistics = 0.557 • Classification Accuracy (After Katrina) Overall Classification Accuracy = 78.79% Overall Kappa Statistics = 0.697 • The low signature separability between building & road, building & trees, grass & trees, water & building caused low classification accuracy ASPRS Tampa Conference, May 10, 2007
Damage Assessment • Road submergence example • Building submergence example • Building & road classes mixed to some extent. ASPRS Tampa Conference, May 10, 2007
Object Based Classification • Object based classification uses segmentation instead of pixel. • Concept: find homogeneous regions classify them • Segmentation can be acquired adjusting the weight of color and shape what is h here ????, heterogenerourity , f is fusion value ASPRS Tampa Conference, May 10, 2007
Effect of color & shape factor – before Katrina; segmentation uses the two factors • Shape=0.1, Color=0.9 • Accuracy=0.91 Kappa=0.88 • Accuracy is over 0.9 • Lot of road & bareland classes disappeared from water class • Shape=0.7, Color=0.3 • Accuracy=0.70, Kappa=0.63 • Water was misclassfied to Road and Bareland • Road & building was misclassified to water • Shape=0.5, Color=0.5 • Accuracy=0.87, Kappa=0.84 • Accuracy enhanced by 0.17 • Water was misclassfied to Road and Bareland • Shape=0.3, Color=0.7 • Accuracy=0.89 Kappa=0.87 • Accuracy enhanced by 0.02 • Water on the road disappeared ASPRS Tampa Conference, May 10, 2007
Object Based Classification • Classification Result of IKONOS image ASPRS Tampa Conference, May 10, 2007
Object Based Classification • The error matrix before Katrina • The classification accuracy has increased from 65.81% to 88.39%. But road is still more misclassified than other features. ASPRS Tampa Conference, May 10, 2007
Object Based Classification • The error matrix after Katrina • The classification accuracy was increased from 78.79% to 92.4%. ASPRS Tampa Conference, May 10, 2007
Use of shape membership function - ikonos • Object based classification adapts fuzzy approach using shape membership function such as length, width, area, the ratio of length & width andthe longest edge of object, etc. • Shape membership function will solve the problem of low accuracy of road class for pre Katrina IKONOS image • The difference of Length/Width between building and road ASPRS Tampa Conference, May 10, 2007 EX) Building skeletons (square), W/L=1.6 EX) road skeletons (long), W/L=4.9
Use of shape membership function • The membership function of building & road ASPRS Tampa Conference, May 10, 2007 Building Road
Use of shape membership function W/O Shape Membership Function With Shape Membership Function IKONOS Image of New Orleans ASPRS Tampa Conference, May 10, 2007
Use of shape membership function • EX) The building objects in the road and grass classes were removed - ikonos ASPRS Tampa Conference, May 10, 2007 Example image of road W/O Shape Membership Function With Shape Membership Function
Use of shape membership function - • EX) The road objects in building class were removed Example image of building W/O Shape Membership Function With Shape Membership Function ASPRS Tampa Conference, May 10, 2007
Change Detection in New Orleans - quickbird • Object Based Classification using Shape membership function was used for Change Detection in New Orleans • By trial and error, scale, color & shape, compactness & smoothness factor was determined like below table ASPRS Tampa Conference, May 10, 2007
Change Detection in New Orleans • Before Katrina (Road) pixel object class • After Katrina (Road) ASPRS Tampa Conference, May 10, 2007 pixel object class
Change Detection in New Orleans • Decision of membership function L/W = 1.5 is found out to be optimal value to divide building and road classes ASPRS Tampa Conference, May 10, 2007
Change Detection in New Orleans ASPRS Tampa Conference, May 10, 2007
Change Detection in New Orleans • Contingency Matrix before Katrina ASPRS Tampa Conference, May 10, 2007
Change Detection in New Orleans • Contingency Matrix after Katrina ASPRS Tampa Conference, May 10, 2007
Change Detection in New Orleans ASPRS Tampa Conference, May 10, 2007
Conclusion • The damaged object such as building and roads could be detected with remote sensing technique which is time and cost-effective approach to assess the impact of natural disaster. • Pixel based classification for Quickbird and IKONOS images were performed. • Object based classification for IKONOS without shape fuzzy rule and Quickbird with shape fuzzy rule were performed. • Roads are harshly damaged because most of them are located in low elevation. • About 13% , 18% of buildingswere estimated to be submerged in each pixel based and object based classification and they are believed to be low level structures such as single story building or edge of the roof. • Optimal decision of the weight between color & shape during segmentation, a proper shape-membership function enhanced the classification accuracy. • For Quickbird images, the subclass of white roof building and road were created under the super class of white urban and they were classified by shape fuzzy membership function inside the super class • The membership value of L/W=1.5 was found out optimal value to divide the white roof building and the road. • Object based classification enhanced the classification accuracy compared to pixel based classification. ASPRS Tampa Conference, May 10, 2007
Reference • Baatz, M. et al. (2004), eCognition User Guide 4, Definiens Imaging, Munchen, Germany • Darwish, A., Leukert, K., Reinhardt, W. (2003), Image Segmentation for the Purpose of Object Based Classification, Geoscience and Remote Sensing Symposium, July 21-25 2003, IGARSS ’03, Proceedings, 2003 IEEE International, Vol(3): 2039-2041 • Department of Homeland Security’s Federal Emergency Management Agency (FEMA) (2005), retrieved September, 2005 from FEMA website: http://www.fema.gov/news/disasters.fema?year=2005 • Digital Globe (2005), Katrina Gallery, retrived September, 2005 from Digital Globe website: http://www.digitalglobe.com/katrina_gallery.html • Lilesand, T.M., Kiefer, R. W, Chipman J. W. (2004), Remote Sensing and Image Interpretation (5th ed.), John Wiley & Sons, Inc., NewYork • Mather, P.(1999) Computer Processing of Remotely Sensed Images, Chichester, Wiley • Renyi, L, Nan, L. (2001), Flood Area and Damage Estimation in Zhejiang, China. Journal of Environmental Management, 66:1-8 • National Oceanic & Atmospheric Administration (2005), Hurricane Katrina Image, retrieved November, 9, 2005 from NOAA website: http://www.srh.noaa.gov/hgx/gifs/Katrina.jpg • Space Imaging (2005), Image Gallery, retrieved September, 2005 from Space Imaging website: http://www.spaceimaging.com/gallery/hurricanes2005/katrina/newOrleansViewer.htm • Tsoukalas L. H., Uhrig R. E. (1997) Fuzzy and Neural Approaches in Engineering, John Wiley & Sons, Inc., NewYork • U.S. Geological Survey (2005), Hurricane Katrina Disaster Response, Hurricane Katrina Posters, retrieved September, 12, 2005 from USGS website: http://eros.usgs.gov/katrina/products.html • U.S. Geological Survey (2005) USGS 073802331 (COE) Lake Pontchartrain at West End, LA, gage height, retrieved September, 12, 2005, from USGS website: http://waterdata.usgs.gov/la/nwis/uv?dd_cd=01&format=gif&period=31&site_no=073802331 • U.S. Geological Survey (2005) National Map Seamless Data Distribution System, DEM file, retrieved September, 12, 2005, from USGS website: http://seamless.usgs.gov • Wikipedia (2005) Economic Effect of Hurricane Katrina, retrieved September, from Wikepedia website: http://en.wikipedia.org/wiki/Economic_effects_of_Hurricane_ Katrina • Wikipedia (2005) Meteorological history of Hurricane Katrina, retrieved September, from Wikepedia website:http://en.wikipedia.org/wiki/Meteorological_history_of_Hurricane Katrina ASPRS Tampa Conference, May 10, 2007