1 / 1

Estimation of Male Probationary Drivers Peer Passenger Crash Rate

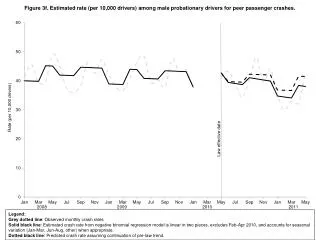
This study analyzes crash rates per 10,000 male probationary drivers with a peer passenger, using statistical regression models. It accounts for seasonal variations and pre-law trends to predict crash rates.

ardith
Télécharger la présentation

Estimation of Male Probationary Drivers Peer Passenger Crash Rate

An Image/Link below is provided (as is) to download presentation Download Policy: Content on the Website is provided to you AS IS for your information and personal use and may not be sold / licensed / shared on other websites without getting consent from its author. Content is provided to you AS IS for your information and personal use only. Download presentation by click this link. While downloading, if for some reason you are not able to download a presentation, the publisher may have deleted the file from their server. During download, if you can't get a presentation, the file might be deleted by the publisher.

E N D

Presentation Transcript


  1. Figure 3f. Estimated rate (per 10,000 drivers) among male probationary drivers for peer passenger crashes. Rate (per 10,000 drivers) Legend: Grey dotted line: Observed monthly crash rates Solid black line: Estimated crash rate from negative binomial regression model is linear in two pieces, excludes Feb-Apr 2010, and accounts for seasonal variation (Jan-Mar, Jun-Aug, other) when appropriate. Dotted black line: Predicted crash rate assuming continuation of pre-law trend.

More Related