Download
1 / 34
340 likes | 537 Vues
Real-time Monitoring and Diagnostic Solution for an HVAC System. ECE Team 169 Anthony Bellantoni (EE) Greg Carmichael ( EngrPhys ) Joe Grassi (EE ) Sponsored by: Qualtech Systems Inc. Advisor: Professor John Chandy. Presentation Outline. • Project Goals

E N D
Real-time Monitoring and Diagnostic Solution for an HVAC System ECE Team 169 Anthony Bellantoni (EE) Greg Carmichael (EngrPhys) Joe Grassi (EE) Sponsored by: Qualtech Systems Inc. Advisor: ProfessorJohn Chandy
Presentation Outline • Project Goals • Brief Explanation of Qualtech Systems, Inc. • Overview of TEAMS Software • HVAC Explanation • Updated and Completed Model • Overview of Detecting a Failure • Project Timeline & Budget • Project Limitations • Lessons Learned
Project Goals •Fix & Build Upon Previous Incomplete Senior Design Project - Update Diagnostic HVAC Model for ITEB • Obtain real-time data from the building sensors - Develop Failure-Detection Code •Combine model and code to detect for faults in real-time.
Qualtech Systems, Inc. •Located in East Hartford, Connecticut (Founded in 1993) • Provide advanced system health management, integrated diagnostics and telemaintenance • Works on any system • Helps improve equipment productivity •TEAMS - Testability Engineering and Maintenance System
TEAMS • Testability Engineering and Maintenance System • Consists of Multiple Components • Designer • RDS • Remote Diagnostic Server • RT • “Real-Time” Data Collection http://tomgpalmer.com/wp-content/uploads/legacy-images/FLASH%20LIGHT.jpg
TEAMS - Designer • Used to create a model of a system, including components with their respective test points • Can be used to model any complex system (e.g.-MRI, Car, Building, etc.)
TEAMS - RDS • Online Server that connects all components of TEAMS software • Decides Which Component is Most Likely Failing From the Designer • Provides Possible Solutions during Manual Maintenance • Stores information gathered for future analyses
TEAMS - RT • Provides Diagnostics in Real-Time • Connects Developed Code with Generated Sensor Values to RDS • Allows for constant connection
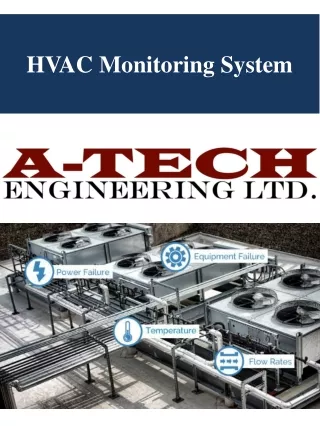
What is HVAC? • Heating Ventilation and Air Conditioning • Processes Air in a Building, Vehicle, or Other Structure • Maximize Occupant(s) Comfort Of Enclosed Area • Range from “Central Air” in Residential Homes to Complex Multi-Building Systems
ITE HVAC System • Basement (Heat Exchanger) • Tunnel to COGEN plant • Penthouse (Air Handler) • VAV (Variable Air Volume) • One For Each Room • Measured on Every Floor at Every Point in System
Failure Detection Code Process 1) Extract sensor values from text file and determine whether or not a failure is occurring 2) Export results file into TEAMS-RT 3) TEAMS-RT combines test results with our model and determines possible failure points
How to Determine a Failure • Set threshold value for maximum deviation from set point • Cannot assume failure after one test • Initiate a counter to determine number of tests in a row that fail • If consecutive tests trend toward the set point, counter returns to 0 • If deviation from the set point is less than the maximum allowed, counter returns to 0 • If n tests in a row fail and do not approach set point, assume failure
Failure-Detection Method Sensor 1 Extract sensor data from txt, determine if failure occurs, then store in either 'pass' or 'fail' txt file. Temperature Sensor 2 Export results to TEAMS-RT Humidity Sensor n
Project Budget http://www.rosemarierealty.com/wp-content/uploads/2012/03/dreamstime_xs_17999966-300x300.jpg http://blog.outreach.com/wp-content/uploads/2011/09/Church-events-on-no-Budget.jpg http://static.seekingalpha.com/uploads/2009/3/4/saupload_mar04_09_bm.jpg http://i.crn.com/images/free_cloud_400.jpg
Final Tasks • Connect our Failure Results with TEAMS RT • Connecting RT with RDS
Project Limitations • Obtaining access to actual sensor valuesMaintenance cost/time value for each component • No access to maintenance costs held by UConn Facilities • Restricted to remote server for TEAMS
Lessons Learned • TEAMS is capable of modeling large systems • Difficult for beginners and requires expert knowledge to build • HVAC systems are complex • Prepare for setbacks • Information from facilities • Remote server issues