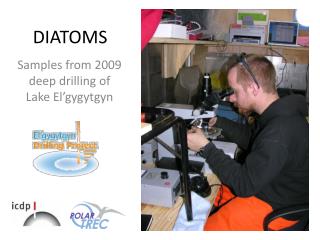
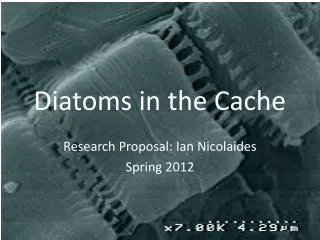
Diatoms in the Cache
Diatoms in the Cache. Research Proposal: Ian Nicolaides Spring 2012. Outline. Characteristics of Diatoms Diatom Research Research Questions Methodology. Frustule or “test” SiO 2 = Inorganic Shell. Frustules are made like two overlapping boxes. epitheca. Septum. hypotheca.

Diatoms in the Cache
E N D
Presentation Transcript
Diatoms in the Cache Research Proposal: Ian Nicolaides Spring 2012
Outline • Characteristics of Diatoms • Diatom Research • Research Questions • Methodology
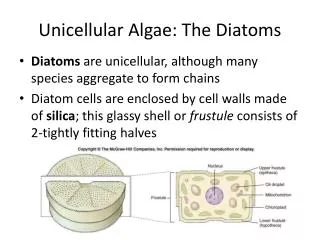
Frustule or “test” SiO2 = Inorganic Shell Frustules are made like two overlapping boxes. epitheca Septum hypotheca Diatoms range in size from 1 to 500 µm the ones in this picture are approx 20 µm
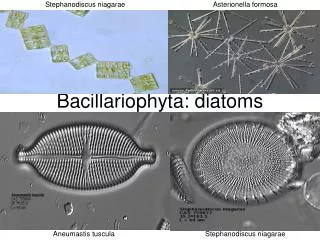
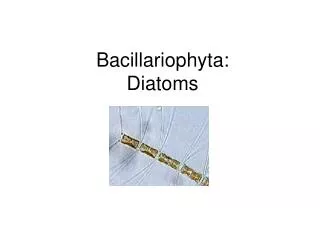
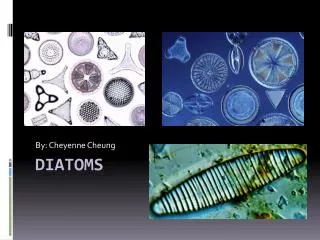
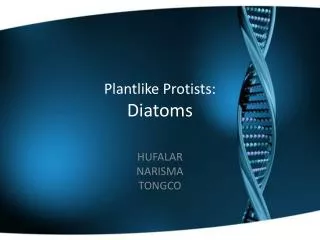
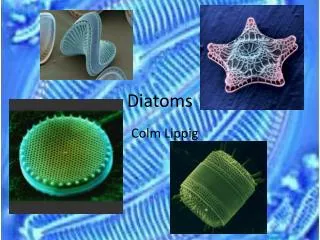
Diatoms come in many shapes and forms. There are approximately 105 species of diatom each with a different shape. 10µm
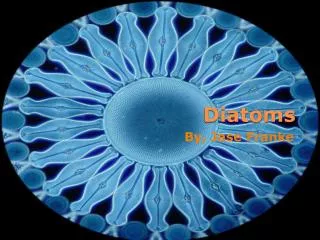
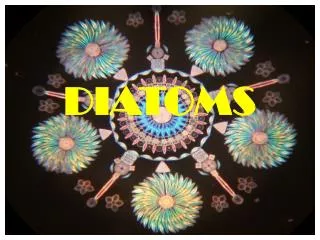
There are two types of diatoms Pinnate – Most species of this type of diatom can move. Centric The colors are partially due to the refraction of light in the silicon shells and partly due to their brown pigmentation.
Diatom Growth Frustules divide (asexually reproduce) by separating and then each part produces another half. The bottom diatom will be slightly smaller. This causes a size range in diatoms. epitheca Septum hypotheca
Research • Humans have jeopardized water quality by altering the natural hydrologic flow of river systems (Poff et al., 1997). • Health and stability of an aquatic ecosystem can be measured with the Diatom Index (Bere& Tundisi, 2010).
Research • Diatoms are sensitive to physical environmental variables; light, moisture, temperature, current velocity, salinity, pH, and oxygen (Van Dame, et al., 1994; Stoermer & Smol, 1999). • Diatom species diversity tends to be higher in waters with intermediate rather than low levels of pollution (De la Rey, 2008).
Need for Further Research • Diatoms have not been adequately studied in the CRW • Diatom studies in hypoxic water as the result of land use changes are limited • My proposal seeks to relate diatoms to water quality based on water velocity and dissolved gas concentrations
Research Question(s) • Will the reduced water velocity of the lower Cache River exhibit decreased levels of diatom diversity? • Will the diversity of diatoms be greater in areas with better water quality as measured by dissolved oxygen and carbon dioxide?
Hypothesis • If water velocity decreases, then, diatom diversity will decrease due to a decrease in dissolved oxygen.
Diatom Collection • 8 collection sites, 4 from the UCR and 4 from the LCR 2 samples from each site • Benthic samples from under water rocks, pebbles, and gravel located one meter off of the shore line. • Pelagic sampling by taking surface water from each river one meter from the shoreline
Additional Data • Water • velocity • pH • dissolved oxygen • dissolved carbon dioxide
Diatom Processing • Clean with 20% hydrogen peroxide • Removes all organic material • Centrifuge & Rinse (3 times) • Inactivates H2O2 • Dry & Fix Slides • For use under light microscope Process adapted from the Addison-Wesley Environmental Science Laboratory Manual
Diatom Diversity Index • 40 power LM magnification • Diatoms observed, typed & counted starting at the top left corner of the cover slip. • If needed, the field was adjusted from left to right horizontally until 20 diatoms were observed. • 4 total rows of 20 counted.
Calculation • Dividing the number of different diatom species by the total number of diatoms observed. • DDI ranges from 0.0 – 1.0 • Poor water quality = 0.00-0.49 • Fair water quality = 0.50-0.79 • Good water quality = 0.80-1.00 Based on guidelines established from the Addison-Wesley Environmental Science Laboratory Manual.