Download
1 / 13
130 likes | 274 Vues
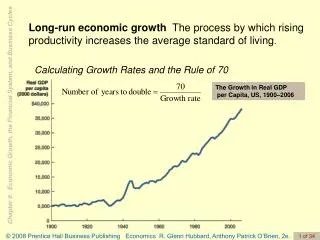
Decomposing the Change in GDP per capita. May 1, 2009 The Employment Lab: New Diagnostic Tools for Employment Focused Development. Using Rwanda as an Example Paul Cichello. Basic Trends, 2000-2006 Source: MINECOFIN (GDP), eicv1 & eicv2 (Employment and Population).

E N D
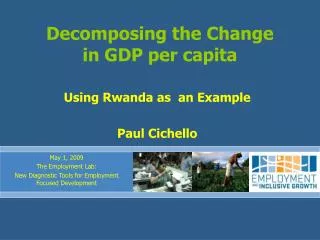
Decomposing the Change in GDP per capita May 1, 2009 The Employment Lab: New Diagnostic Tools for Employment Focused Development Using Rwanda as an Example Paul Cichello
Basic Trends, 2000-2006 Source: MINECOFIN (GDP), eicv1 & eicv2 (Employment and Population) * 94 2001 RWF = $1 US (PPP)
Decomposing change in GDP per capita Y/N = (Y/E)(E/A)(A/N) GDP (value added) per capita can be decomposed into 3 parts: • Output per worker • Employment to (Working Aged) Population Ratio • Working Aged Population to Total Population Decomposition of the change in GDP uses Shapley approach to divide each component As with all such decompositions, this does not provide a direct causal interpretation.
Population Data for Entire Population and Working Aged (Census) 2) GDP Value Added by Sector from National Accounts 3) Micro-level Employment Data by Sector Need these for two points in time Data Needs
Increased share of the population was working aged (15-64) Decomposing change in GDP per capita
Lower participation is associated with a sizable decline in GDP per capita of 6,023 RWF 7.4% of GDP per cap in 2000; 36% of the ∆ in GDP per capita This was driven by 15 to 24 year-olds (This age group also had sizeable gains in enrollment rates) Decomposing change in GDP per capita
Decomposing change in GDP per capita due to employment changes Note: Values represent the contribution to the change in GDP per capita Percentage values are in percent of total change in GDP per capita
Notice the increase in output per worker. This drives growth in GDP per capita. 25% of GDP per cap in 2000; 122% of the ∆ in GDP per capita Decomposing change in GDP per capita
Decomposing change in GDP per capita due to changes in output per worker Note: Values represent the contribution to the change in GDP per capita Percentage values are in percent of total change in GDP per capita
Further analysis- details in guide • Examine inter-sectoral changes accounted for by sector • Decompose into changes in output per worker (within sectors) into TFP and capital-labor ratio components • Need information on: • share of national income going towards capital • Capital STOCK
Can it be done in practice??? This decomposition sounds complicated! Will it be time-consuming to compute??? LET’S SEE
Will see today • Demonstration (now) • Output in exercises (next) • To see what we can learn from other experiences • Does it tell us where to look?